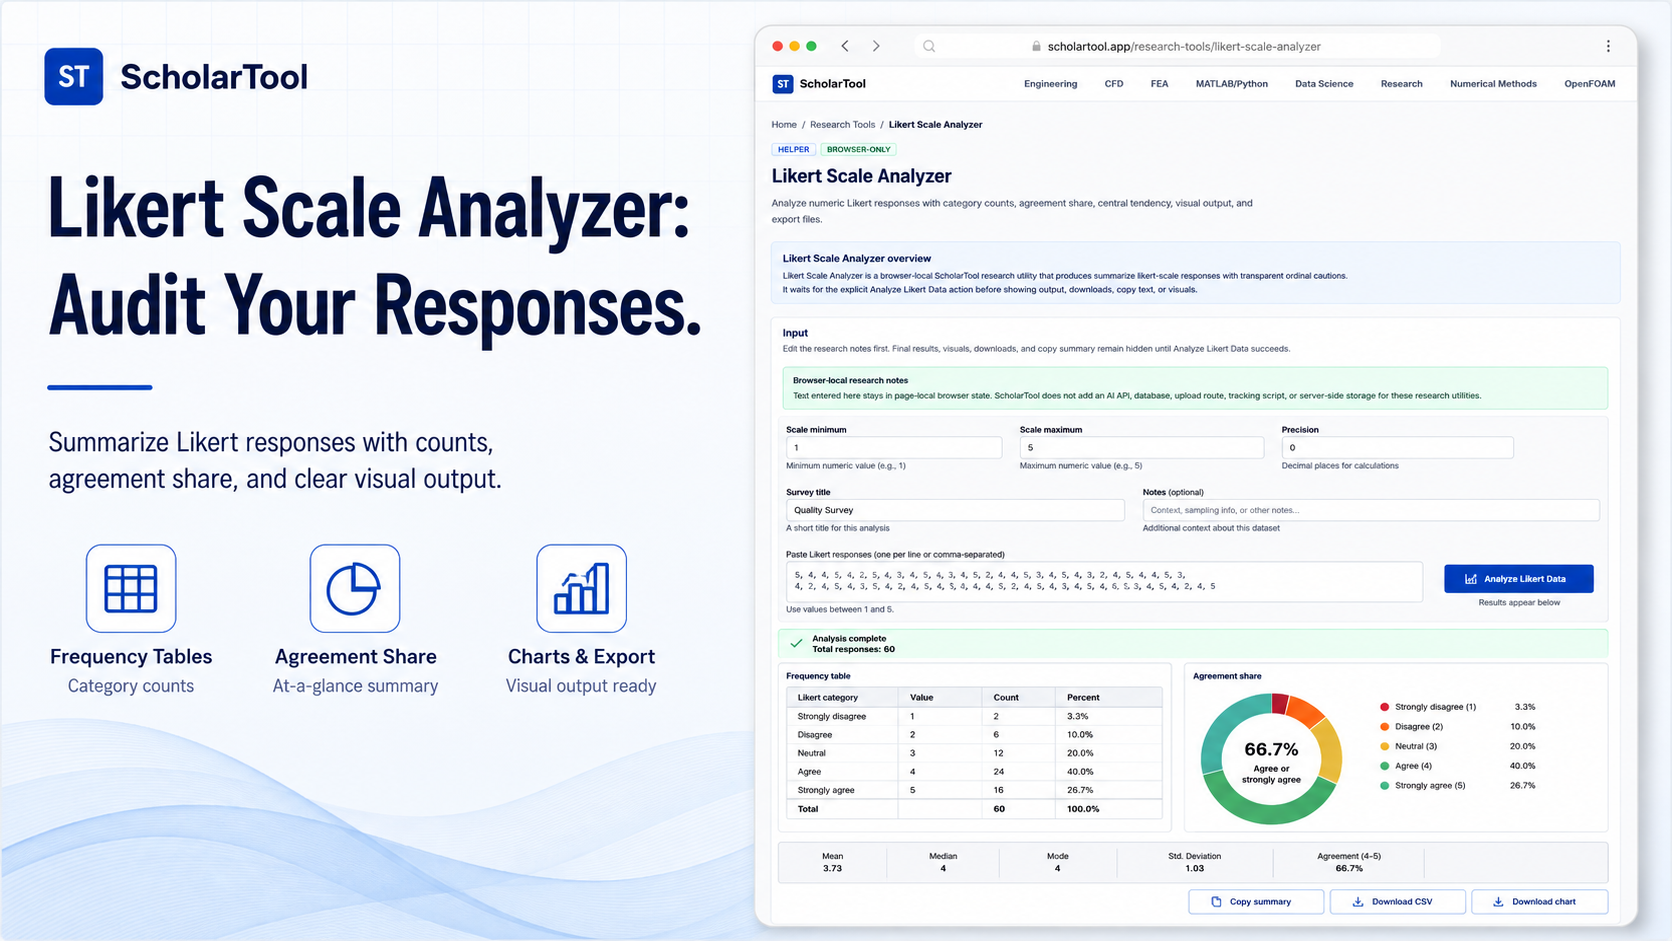
Likert Scale Analyzer: Online Survey Response Summary Tool
When I reach the analysis phase of a survey project whether I am investigating student engagement in a classroom or patient satisfaction in a clinic the “first point of friction” is rarely the high-level math. Instead, it is the tedious task of converting a raw string of numeric codes (1, 5, 4, 3…) into a meaningful summary. As noted in Practical Research, measurement is the foundation of the research process, yet raw data remains meaningless until you identify the patterns within it. If you misinterpret these ordinal responses, your conclusions can become numerically flawed.
I find that for many graduate students, the gap between data collection and a publishable frequency table is filled with manual spreadsheet errors. That is why I use the Likert Scale Analyzer from ScholarTool. It is a browser-local research utility designed to convert your raw numeric responses into a transparent “math receipt” featuring category counts, agreement shares, and central tendency. It prioritizes instructional clarity and data residency, ensuring your proprietary research values never leave your machine.
What the Likert Scale Analyzer Helps You Do
The primary purpose of this tool is to help you move from a “pile” of survey codes to a structured planning artifact fit for a thesis or manuscript. In technical terms, it parses numeric responses to report frequency distributions and agreement percentages.
What I find useful here is the focus on “transparency of interpretation”. Unlike standard statistical software that might treat ordinal data like continuous intervals without warning, this analyzer reminds you that interpreting the “neutral” midpoint requires specific care. It doesn’t just give you a table; it provides a visual representation of agreement share, helping you identify early on if your responses are skewed toward one extreme.
Inputs You Can Use
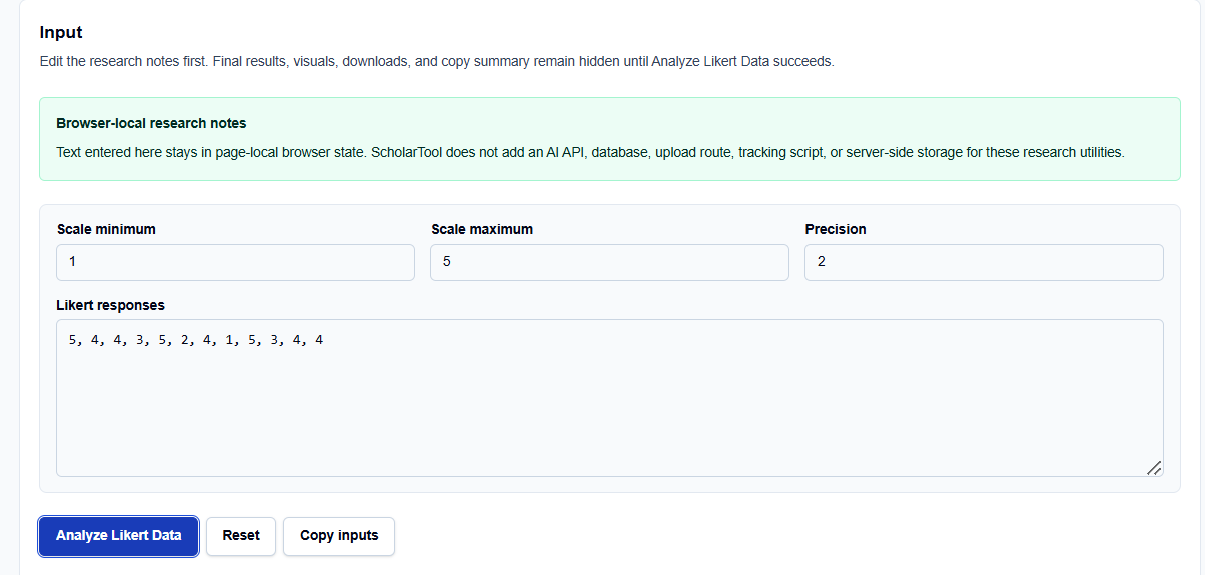
The interface is built with a configuration-first layout to ensure your data is read correctly before any scoring occurs.
Scale Ranges and Precision
You begin by defining your scale typically a minimum of 1 and a maximum of 5 or 7. I like that you can adjust the Precision to two decimal places, ensuring that your percentage calculations meet the rigorous standards of APA or NIH reporting.
Numeric Responses and Research Notes
In the Likert responses field, you enter your numeric codes separated by commas. Below this, you can include free-text Notes regarding your methodology or criteria. What I find indispensable is that this text stays entirely within the page-local browser state; ScholarTool does not use an AI API or server-side storage for these utilities.
How I Use the Tool
My typical workflow starts during the preliminary data-screening phase. I open the Likert Scale Analyzer.
I replace the default example rows with my own project-specific response string. Once I have set the scale maximum to 5, I click Analyze Likert Data. I find it practical that the result section and visuals remain hidden until this action succeeds, preventing me from acting on stale data. If I change a single numeric entry later, the tool automatically hides the old result, requiring a rerun a vital professional safeguard to ensure the output always matches the current input.
Understanding the Results
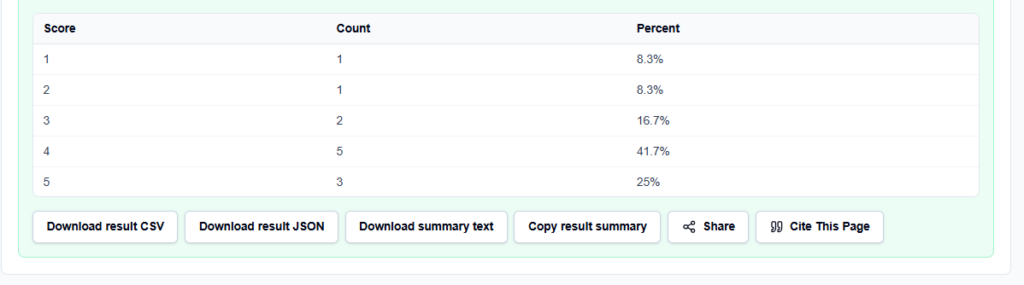
The result section provides the Likert frequency table first, identifying the exact count for each scale point. For a professional audit, I focus on:
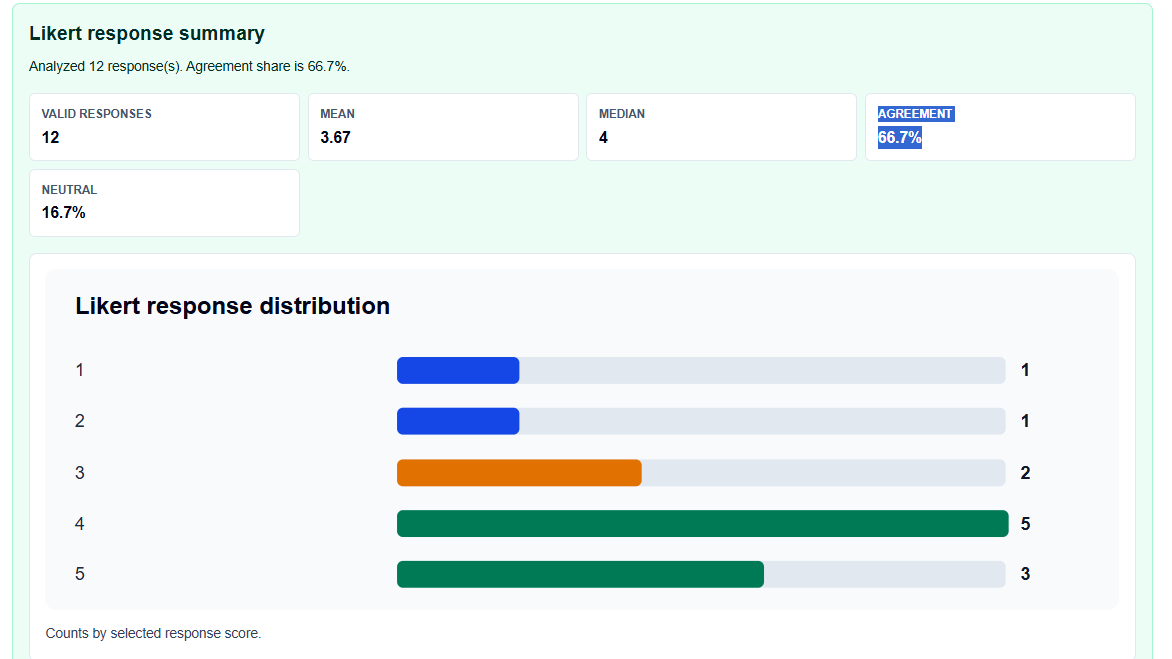
- n (Number of records): This helps me verify that the tool has parsed every survey response correctly.
- Agreement Share: This visual output shows the percentage of participants who selected each option, which is essential for reporting central tendency in ordinal sets.
- Readiness Score: While the tool provides a checklist score, I treat it as a progress metric rather than final academic approval.
A Comparative Perspective: Items vs. Scales
From a professional perspective, it is critical to distinguish between a “Likert Item” (a single statement) and a “Likert Scale” (a composite of several items).
- Likert Item: Best analyzed using frequency counts and medians.
- Likert Scale: Often used to generate a summated score for a complex construct.
- ScholarTool Analyzer: This tool excels at the item level, providing the “math receipt” you need to justify how individual questions contribute to your broader research objective.
A Practical Example: The Quality Survey
Suppose I enter a string of twelve responses: 5, 4, 4, 3, 5, 2, 4, 1, 5, 3, 4, 4. After clicking the action button, the tool reports $n=12$ and identifies that “4” was the most frequent response. Seeing this “math receipt” allows me to move confidently to the Descriptive Statistics Calculator for more advanced modeling.
Mistakes I Would Avoid
One common pitfall is using a workflow score as proof of completion. As the tool’s guidance reminds us, a high readiness score does not replace qualified professional judgment.
Another mistake is forgetting to recode reverse-coded items. If your survey has negatively worded questions, you must manually recode those values before entering them into the analyzer to ensure your agreement share is accurate.
Try the Free Likert Scale Analyzer
Before you manually count “4s” and “5s” in a text editor, take a minute to generate a transparent response audit. It is the fastest way to ground your survey analysis in structured logic while maintaining total browser privacy.
Try the Likert Scale Analyzer here. To complete your research toolkit, you may also find the Questionnaire Codebook Builder or the Cronbach Alpha Calculator essential for your academic success.
FAQ
1. Does this tool automatically calculate my Cronbach’s alpha?
No. This tool is designed to summarize the frequency and distribution of individual response items. To calculate internal consistency reliability, you should use the dedicated ScholarTool Cronbach Alpha Calculator.
2. Is my proprietary survey text sent to a database?
No. The analyzer runs entirely in your browser using page-local state. ScholarTool does not add a database, API upload route, or AI service for your research text, ensuring total data residency.
3. Why do the results disappear when I edit my response string?
The analyzer is designed to prevent “stale” or misleading artifacts. If you change your inputs, the old output is hidden until you click “Analyze Likert Data” again, ensuring that your exported tables always match your current data.