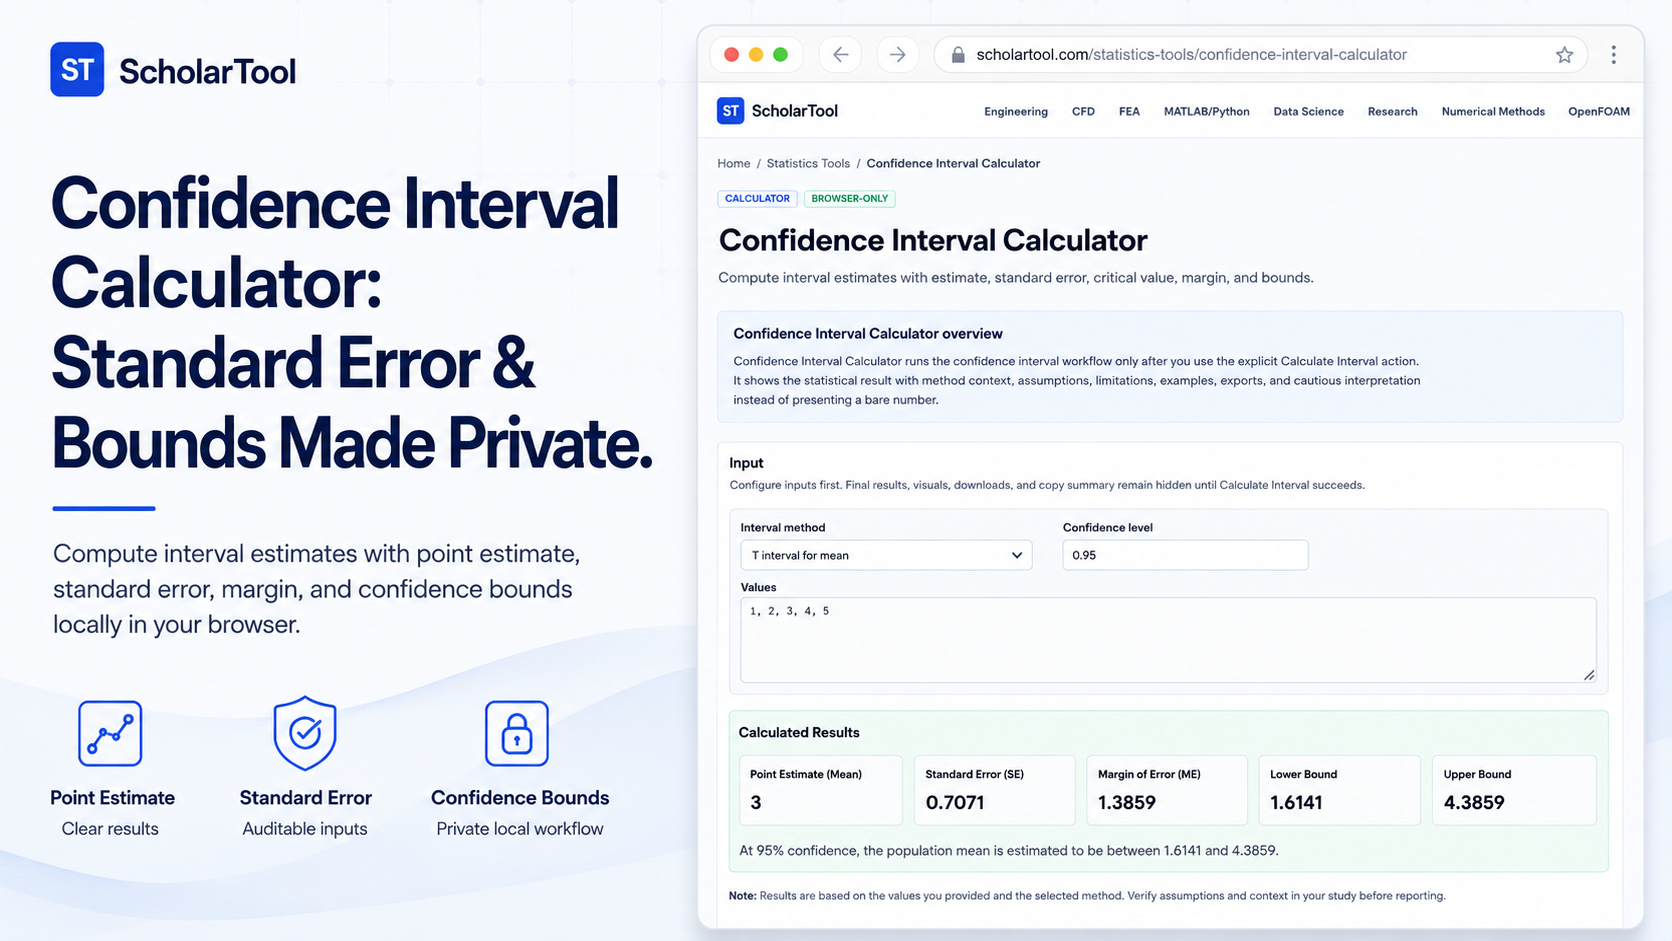
Confidence Interval Calculator: Power Sizing Utility
When transitioning a research project from raw data coordinates to statistical reporting, establishing estimate precision is a key point of friction. Every researcher must present confidence intervals to describe the uncertainty surrounding sample means or proportions. Staring at your draft manuscript and guessing these ranges risks overclaiming accuracy or failing to acknowledge sample size limits.
To bridge this gap during exploratory data analysis, I use the Confidence Interval Calculator from ScholarTool. This browser-local utility estimates limits with critical values, standard errors, and margins. Because it runs locally, your datasets are processed securely in your browser’s page state, ensuring 100% data privacy.
What the Confidence Interval Calculator Helps You Do
The primary purpose of this tool is to act as an auditable “math receipt” during research planning and preliminary data reviews. Rather than forcing you to struggle with manual formulas, it generates structured bounds alongside clear statistical context.
What I find useful here is how the tool accommodates several distinct scenarios. You can toggle between t-intervals and z-intervals for means, Wilson intervals for proportions, and Welch intervals for independent mean differences. This comparative capability helps you quickly run sensitivity checks, showing how interval widths respond as your sample standard deviations or confidence thresholds change.
Inputs You Can Use
The interface features a configuration-first layout to ensure your assumptions are explicitly documented:
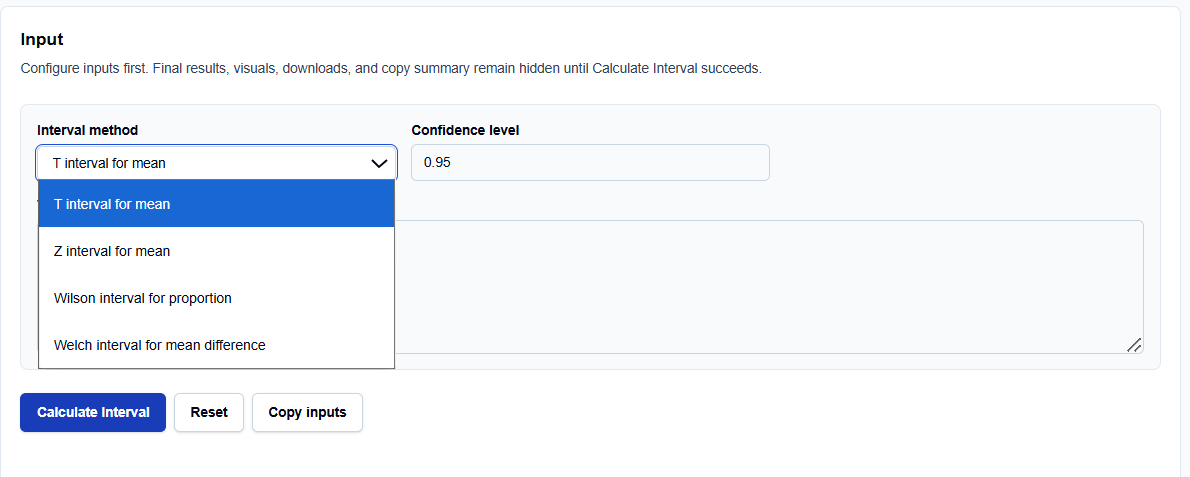
- Interval Method: Select T-interval, Z-interval, Wilson score, or Welch interval depending on your parameters and sample characteristics.
- Confidence Level: You can choose your desired confidence level (default is 0.95).
- Values Text Area: If your data is available in this form, paste raw, comma-separated numeric sample points, successes, or group statistics.
How I Use the Tool
I open the Confidence Interval Calculator. First, select the interval method matching your study design. When I enter our raw sample values or successes, I verify that they align with the chosen parameter structure. For means, entering values like “1, 2, 3, 4, 5” allows the browser to compute the point estimate and sample standard deviation locally. After typing, click Calculate Interval. All results remain hidden until this button is clicked, preventing stale data errors. Changing any input automatically hides the old output.
Understanding the Results
The result section helps you verify your estimates by displaying several structured outputs:
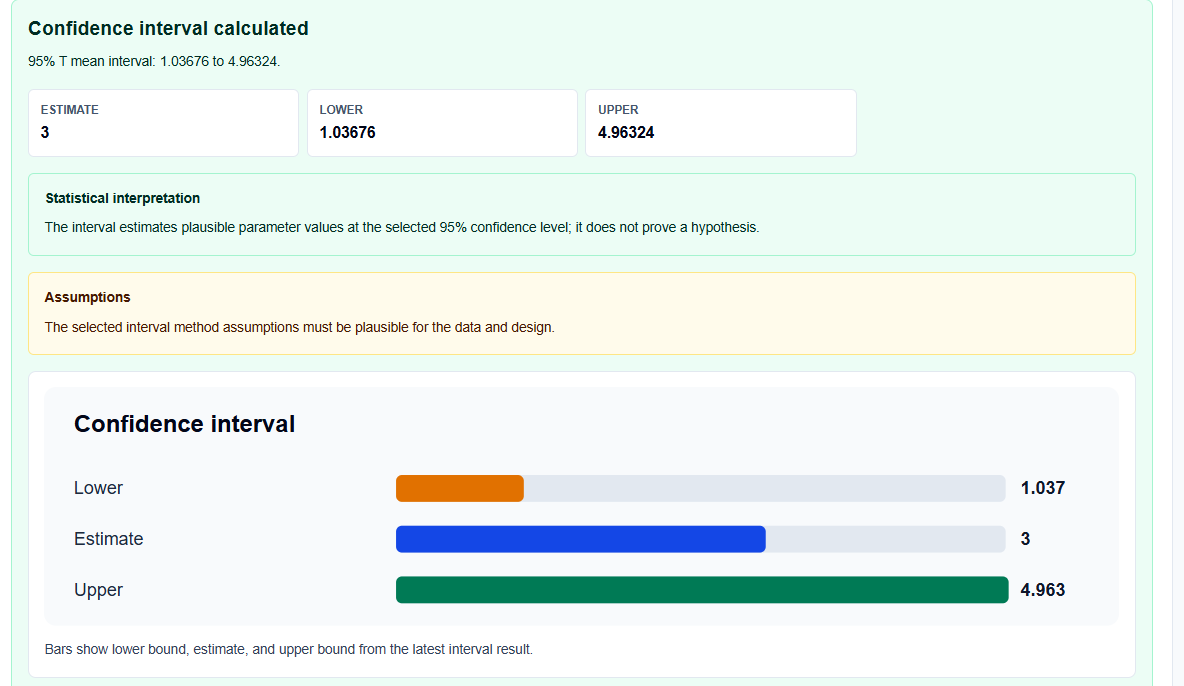
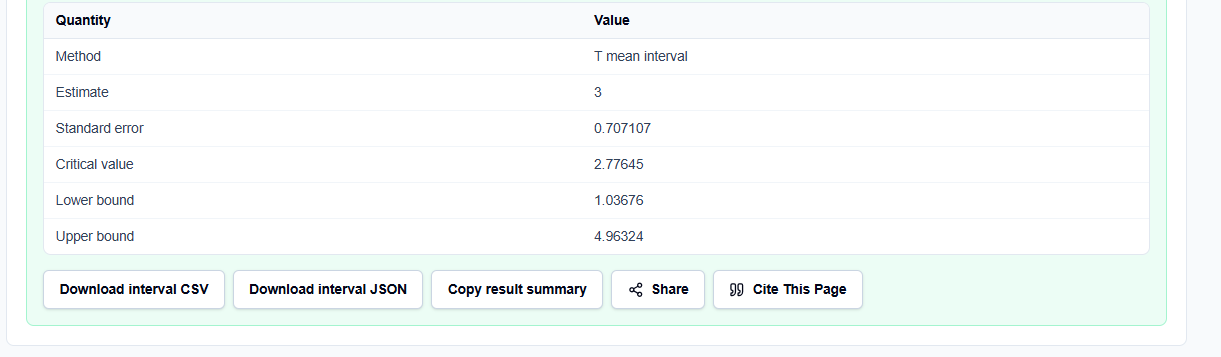
- Point Estimate: Displays the calculated sample mean or binomial proportion.
- Standard Error (SE): Displays the estimated standard error of the point estimator.
- Critical Value: Displays the exact t-statistic or z-score corresponding to your confidence level.
- Margin of Error & Bounds: Sums and subtracts the margin to display the lower and upper bounds of your confidence interval.
A Practical Example: The Five-Point Sample Takeoff
Consider a realistic metric check. Suppose we enter the default sequence “1, 2, 3, 4, 5” under a T-interval at 95% confidence. The tool evaluates a sample mean of 3, a standard deviation of 1.5811, and df = 4. It computes standard error SE = 1.5811 / sqrt(5) = 0.7071 and fetches t_(0.025, 4) = 2.7764. The margin is 2.7764 * 0.7071 = 1.9632, yielding the bounds [1.0368, 4.9632].
Mistakes I Would Avoid
One critical mistake is making the probability claim. Saying that a specific, calculated interval has a 95% probability of containing the true population mean is incorrect. Once an interval is calculated, it either contains the parameter or it does not; the 95% level refers only to the long-run success of the estimation procedure over repeated samples.
Another major pitfall is using the z-interval when the population standard deviation is unknown. Unless you have a massive sample size, you must use the t-interval to account for sample variance estimation uncertainty.
Try the Free Confidence Interval Calculator
If you want to eliminate manual takeoff errors and ensure complete data privacy, try this browser-first tool. It is free, secure, and processes all parameters locally.
Try the Confidence Interval Calculator on ScholarTool
To complete your research, you can easily chain this with the Sample Size Calculator or perform hypothesis testing using the T-Test Calculator. You can also inspect and clean raw data using Data Science CSV Tools.
FAQ
1. What is the difference between a Wald interval and a Wilson score interval?
For binomial proportions, the Wald interval performs poorly with small sample sizes or extreme rates. The Wilson score interval adjusts for these limitations, providing more stable coverage boundaries.
2. Are my custom datasets or survey records uploaded to an external server?
No. All numeric observations and planning values are processed entirely locally on your device in your browser’s page state. ScholarTool does not transmit your records to any third-party database.
3. Why do the results clear if I change a number on the form?
This is a built-in safety guard. If you modify any parameter or sample point, the output block automatically hides until you click “Calculate Interval” again, preventing stale statistics from being copied.