CSV Data Profiler: Online Column & Type Inspector
When I start a new data science project whether I’m analyzing supermarket point-of-sale data or processing sensor readings the first thing I face is the “data situation”. As the old adage goes, “garbage in, garbage out”. If you don’t understand the structure, types, and quality of your raw data before you begin cleaning or modeling, your final results will be physically meaningless or numerically flawed.
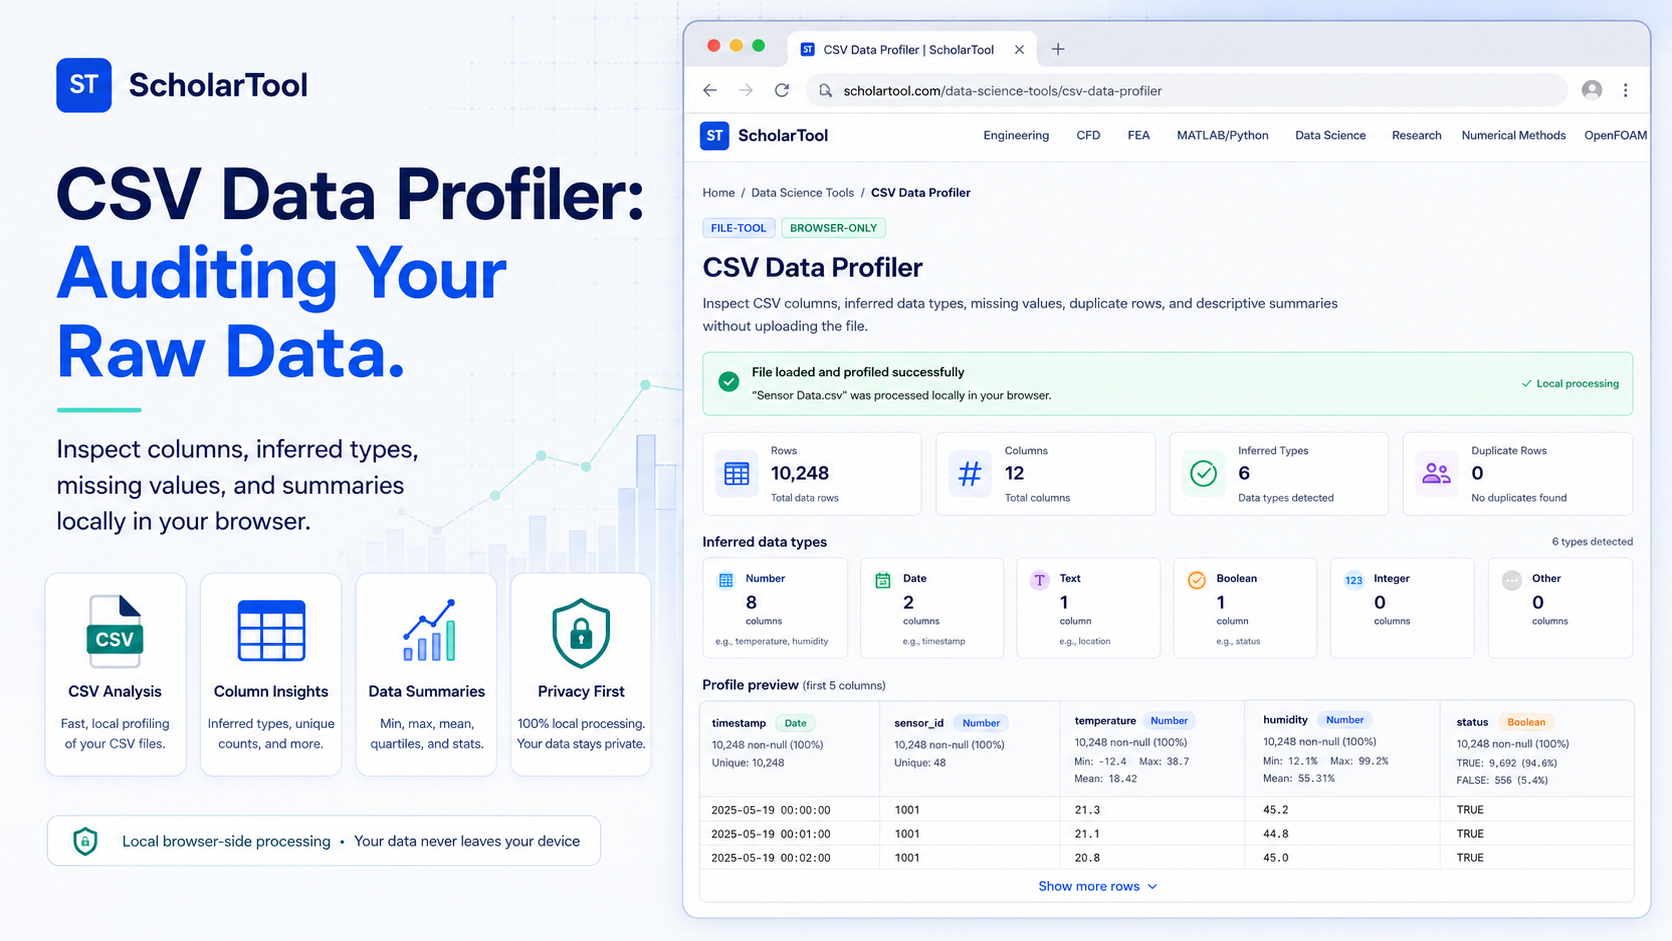
I find that the most time-consuming aspect of being a data scientist is ensuring data is “fit for the purpose” intended. While I could write Python or R scripts to generate summaries every time, I find that for a first-pass inspection, I need something faster and more private. That is why I use the CSV Data Profiler from ScholarTool. It is a deterministic, browser-local utility designed to give you a “math receipt” of your dataset’s health without the risk of uploading proprietary research to an external server.
What the CSV Data Profiler Helps You Do
The primary purpose of this tool is to help you move up the pyramid from raw data to actionable information. In technical terms, it performs a first-pass inspection of row and column counts, inferred data types, and uniqueness.
What I find useful here is the focus on “data sovereignty.” Unlike standard AI-based parsers that send your files to a cloud-analysis API, this profiler works entirely on the client side. It uses Papa Parse to handle the heavy lifting of CSV parsing right in your browser tab. This means your case-specific values and proprietary column names never leave your machine.
Inputs You Can Use
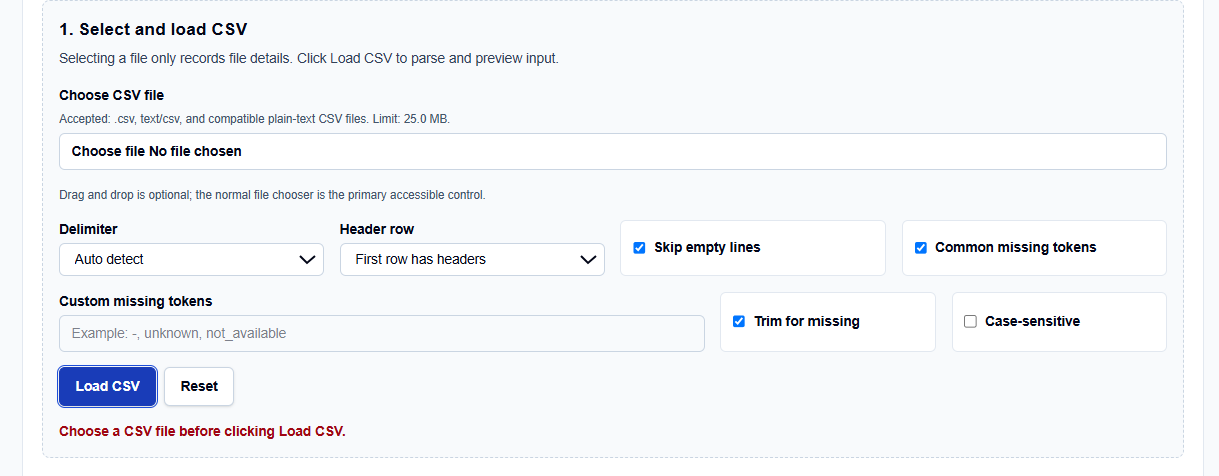
The interface is built with a configuration-first layout that ensures your data is read correctly before profiling begins.
Loading and Delimiters
You begin by selecting your file (with a limit of 25.0 MB). I like that it doesn’t just assume a comma delimiter; you can choose Semicolon, Tab, or Pipe, or even let the tool Auto detect the format.
Header and Missing Token Toggles
You can toggle whether the First row has headers and instruct the tool to Skip empty lines. A professional feature I frequently use is the Custom missing tokens field. If your dataset uses “999” or “null” to represent missing data instead of standard NAs, you can configure the profiler to recognize these before you run the analysis.
How I Use the Tool
My typical workflow starts when I receive a new, uncleaned CSV from a client or a repository like UCI. I open the CSV Data Profiler.
Once I’ve loaded the file and configured the missing tokens, I click Analyze CSV. I find it practical that the results, visuals, and download actions remain hidden until the analysis succeeds. I then review the inferred types. If the profiler identifies a column as “mixed,” it acts as a professional reminder that I need to standardize those entries in Pandas or R before I can perform arithmetic operations like calculating a mean.
Understanding the Results
The result section provides a Summary table first, giving you the row/column count and a readiness score. For a professional audit, I focus on:
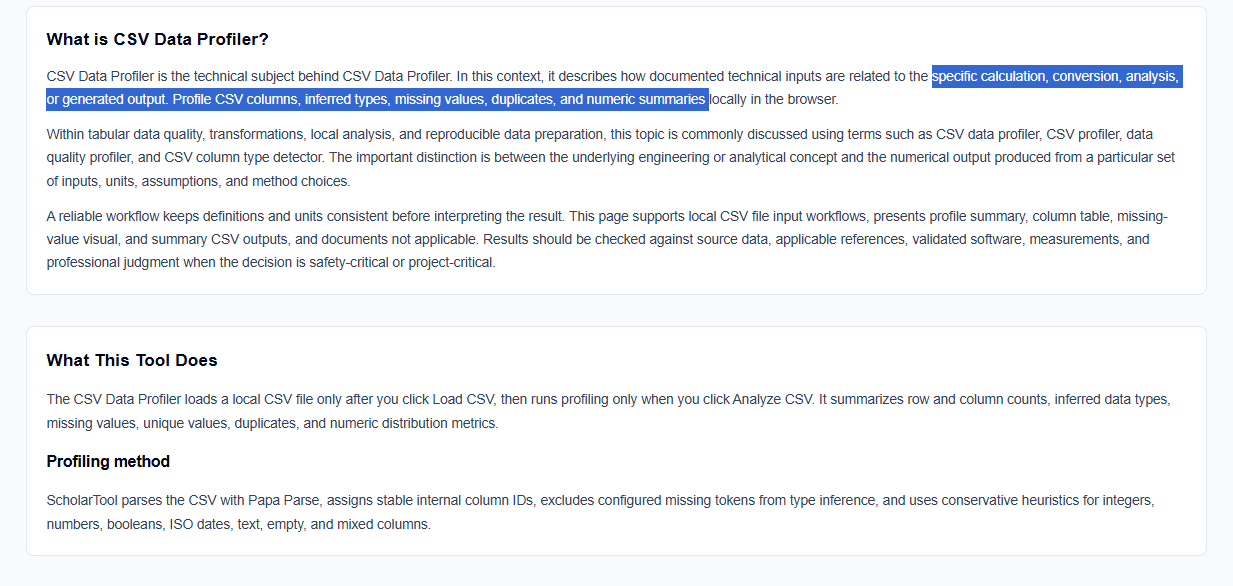
- Inferred Data Types: The tool uses conservative heuristics to detect integers, numbers, booleans, and ISO dates.
- Missing and Duplicate Counts: It identifies how many cells are empty or contain missing tokens, alongside a count of duplicate rows.
- Numeric Distribution Metrics: For numeric columns, it provides basic distribution stats that help me identify the “center” of the variability.
A Comparative Perspective: Browser-Local vs. Script-Based Profiling
From a professional perspective, you have several options for profiling:
- Pandas (df.info() or df.describe()): Incredibly powerful for large datasets but requires a Python environment and manual coding for every check.
- R (str() and summary()): Great for revealing structure, though long outputs can scroll off the console screen.
- The CSV Data Profiler: Best for quick, private audits of datasets up to 200,000 rows. It provides a visual audit and a downloadable summary without needing to install packages or write a single line of code.
A Practical Example: The Sensor CSV
Suppose I load a sensor CSV with columns for time, pressure, temperature, and status. After clicking Analyze CSV, the profiler identifies that pressure is numeric but temperature is “mixed” because someone entered “N/A” in three cells. The tool also flags two duplicate rows where the sensor double-reported a reading. This “math receipt” allows me to go into my cleaning script knowing exactly which rows and columns need attention.
Mistakes I Would Avoid
One common pitfall is assuming inferred types are final modeling types. Just because the tool detects an integer doesn’t mean you shouldn’t review it to ensure it isn’t actually an identifier or a category code.
Another mistake is ignoring cardinality. High-cardinality text columns are often identifiers, not errors. I always check the uniqueness count to distinguish between a “Key” column and a qualitative “Category” column.
Try the Free CSV Data Profiler
Before you spend another hour debugging a Pandas read_csv error, take a minute to generate a transparent data profile. It is the fastest way to ground your preprocessing in structured logic while maintaining total browser privacy.
Try the CSV Data Profiler here. To complete your data science toolkit, you may also find the Missing Value Analyzer or the Correlation Matrix Calculator essential for your workflow.
FAQ
1. Does the profiler change my original CSV file?
No. The profiler is a read-only inspection tool. It reports on the loaded dataset and allows you to download a summary, but it does not modify the content of your original file.
2. Why was my large CSV file rejected?
The browser-local workflow enforces a 25 MB file limit to prevent your browser from freezing. For files larger than this, or those with more than 250 columns, you should use a script-based profiler like Pandas or R.
3. How does the tool handle duplicate headers?
If your CSV has columns with the same name, the profiler preserves the names for display but assigns stable internal IDs to each column. This ensures that columns are not silently merged during the analysis.