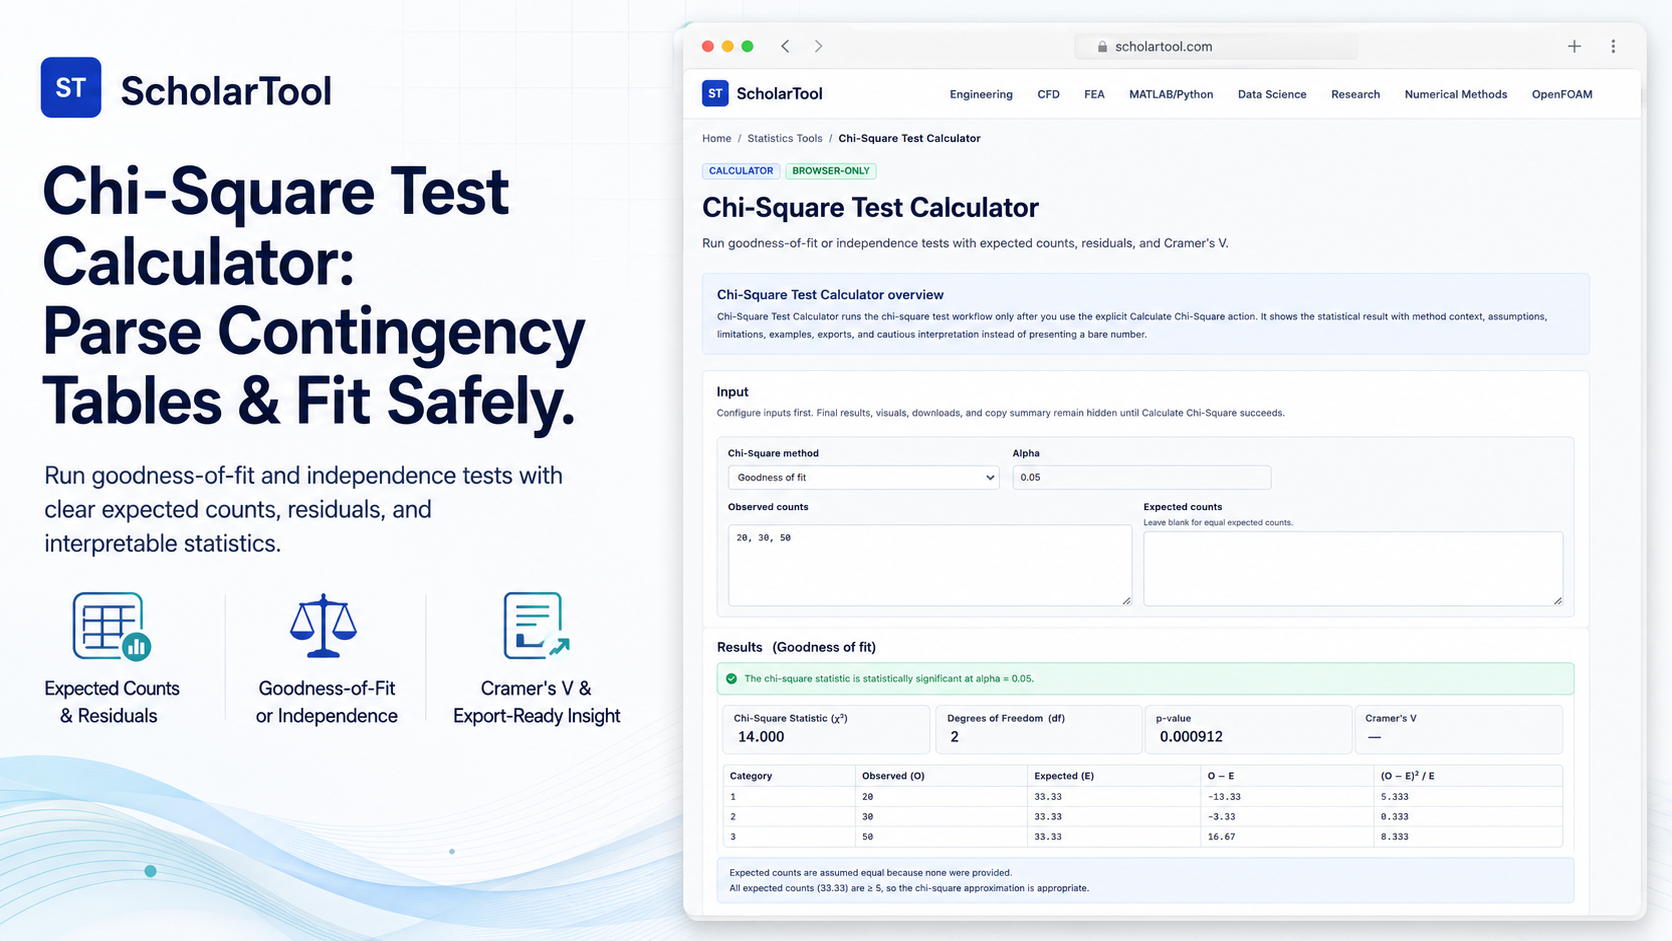
Chi-Square Test Calculator: Private Frequency Sizer
When transitioning a quantitative research project from raw frequency counts to formal statistical reporting, verifying categorical distributions is a major point of friction. Every researcher must determine if their observed counts align with theoretical expectations or if two categorical variables share a significant association. Staring at draft tables and guessing these patterns without an auditable “math receipt” risks underpowering your research or ignoring underlying approximation limits.
To bridge this bottleneck with high accuracy and complete privacy, I use the Chi-Square Test Calculator from ScholarTool. This local statistics utility estimates goodness-of-fit and independence tests with expected counts, residuals, and Cramer’s V. Because all calculations execute entirely in your local browser tab using client-side TypeScript logic, your proprietary observations are never uploaded to any external database, ensuring 100% data sovereignty.
What the Chi-Square Test Calculator Helps You Do
The primary purpose of this tool is to act as an exploratory data analysis takeoff aid during early research planning and verification. Rather than forcing you to configure heavy programming environments or pay for expensive software, it organizes parameters into a clear, structured framework.
What I find useful here is how the tool keeps input preparation separate from final outputs. It does not run calculations automatically while typing, preventing annoying lags on larger datasets. Instead, the results update only when clicking calculate, allowing rapid sensitivity checks on alpha thresholds.
While professional software like StatCrunch or Dataplot requires steep learning curves and cloud uploads, this browser-first utility handles the heavy categorical arithmetic instantly.
Inputs You Can Use
The interface features a configuration-first layout to ensure your statistical assumptions are structurally sound:
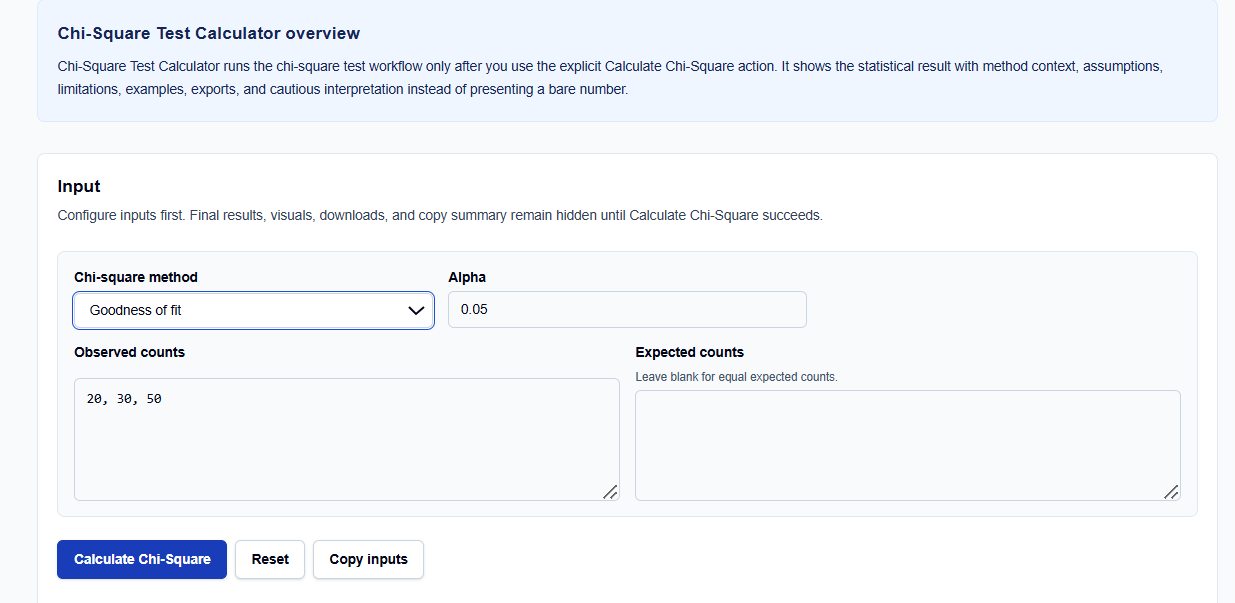
- Chi-Square Method: You can choose between Goodness of fit (comparing one distribution to expected frequencies) or Independence (evaluating a contingency table).
- Alpha Level: Set your significance threshold (default is 0.05) to control your Type I error rate.
- Observed Counts: Enter your raw category tallies separated by commas or spaces. If your data is available in this form, you can paste row sequences directly into the text area.
- Expected Counts: Input your baseline expectations, or leave blank to evaluate equal expected frequencies.
How I Use the Tool
I open the Chi-Square Test Calculator. First, select your input mode.
When I enter our raw observed counts into the manual text area, I verify that they align with the expected format. For instance, testing a 2-by-2 independence table requires entering row values like “20, 15” on row one and “12, 18” on row two. Next, you can choose to modify the alpha level. Once my assumptions are set, I click Calculate Chi-Square. All output summaries, residual tables, and copy features remain hidden until this button is clicked, preventing stale default figures. If you edit any input afterward, results automatically hide.
Understanding the Results
The result section helps you verify the output through several structured parameters:
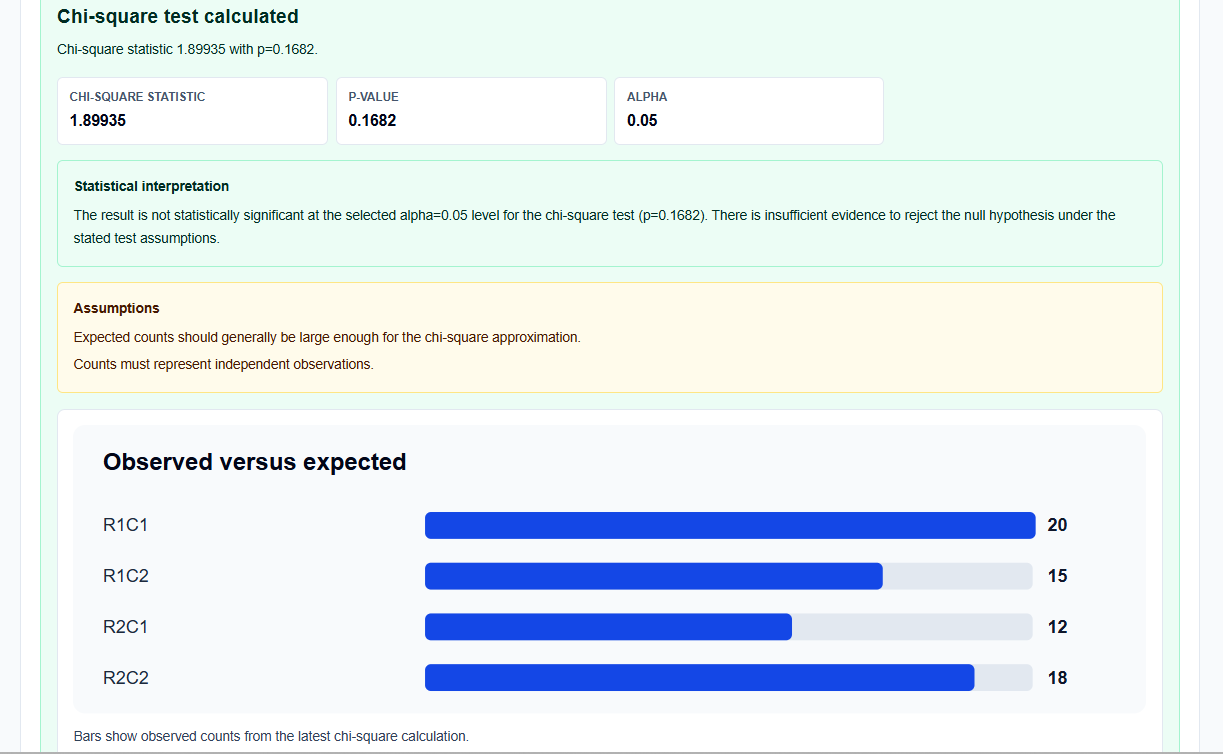
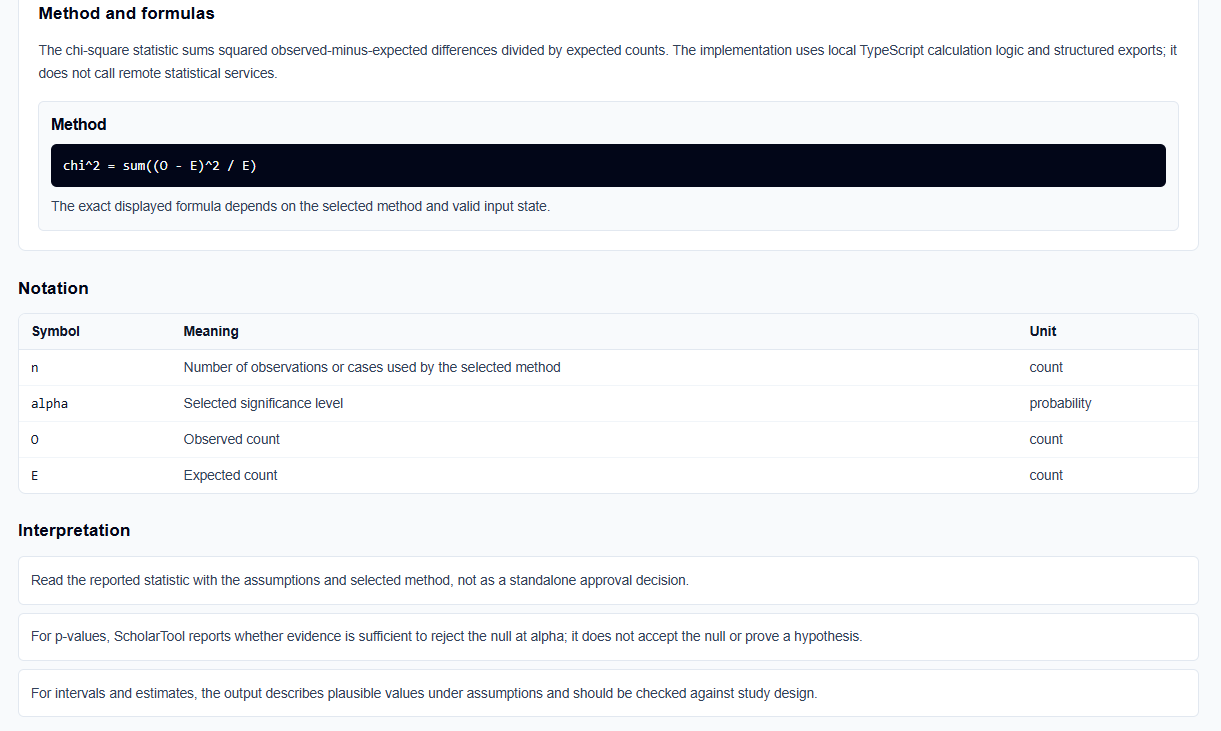
- Chi-Square Statistic (\(\chi^2\)): Sums the squared observed-minus-expected differences divided by expected counts.
- Degrees of Freedom (\(df\)) & P-Value: Reports your derived degrees of freedom alongside the exact p-value, showing whether the observed pattern departs significantly from expectations.
- Residual Table: Displays observed-minus-expected differences to illustrate where your cells deviate most.
- Cramer’s V: Reports the association effect-size magnitude for independence contingency tables.
A Practical Example: Goodness of Fit Sizing
Consider a realistic baseline check. Suppose we evaluate a sample of three categories with observed counts of 20, 30, and 50 against equal expectations at alpha 0.05.
With expected counts left blank, clicking calculate evaluates:
- Expected Counts: The total sample size is 100, yielding an expected count of 33.33 per category.
- Observed-minus-Expected Residuals: Calculates as -13.33, -3.33, and 16.67.
- Chi-Square Statistic: \[\chi^2 = \sum \frac{(O_i – E_i)^2}{E_i} = \frac{(-13.33)^2}{33.33} + \frac{(-3.33)^2}{33.33} + \frac{(16.67)^2}{33.33} = 14.0\]
- Statistical Conclusion: Reports a significant p-value for 2 degrees of freedom, showing a systematic departure from equal distribution.
Mistakes I Would Avoid
One critical mistake is using percentages instead of counts. Chi-square tests are strictly designed for discrete frequency counts; entering percentages invalidates the standard error math and yields incorrect p-values.
Another major pitfall is interpreting association as causation. High contingency table correlations only indicate mathematical fit, not causal direction.
Try the Free Chi-Square Test Calculator
To eliminate manual planning errors and protect your data, try the tool today. It is free, secure, and runs entirely in your local browser tab.
Try the Chi-Square Test Calculator on ScholarTool
You can chain this with the Descriptive Statistics Calculator or the Correlation Significance Calculator. You can also prepare files using Data Science CSV Tools or explore technical utilities in the Research Tools category.
FAQ
1. What is the difference between a goodness-of-fit test and an independence test?
A goodness-of-fit test compares a single category count distribution to a predetermined or equal expected pattern. An independence test evaluates a two-dimensional contingency table to determine whether two categorical factors are mathematically associated.
2. Are my custom datasets or survey tallies uploaded to an external server?
No. All entered frequency counts, alpha levels, and expected values are processed entirely locally on your device in your browser’s page state. ScholarTool does not transmit your records or files to any third-party database or calculation API, ensuring complete privacy.
3. Why do results clear and hide automatically if I edit a number on the form?
This is a built-in safety guard. If you modify any observed count, expected value, or significance threshold, the output block automatically hides until you click “Calculate Chi-Square” again, preventing stale statistical records from being copied into your research worksheets.