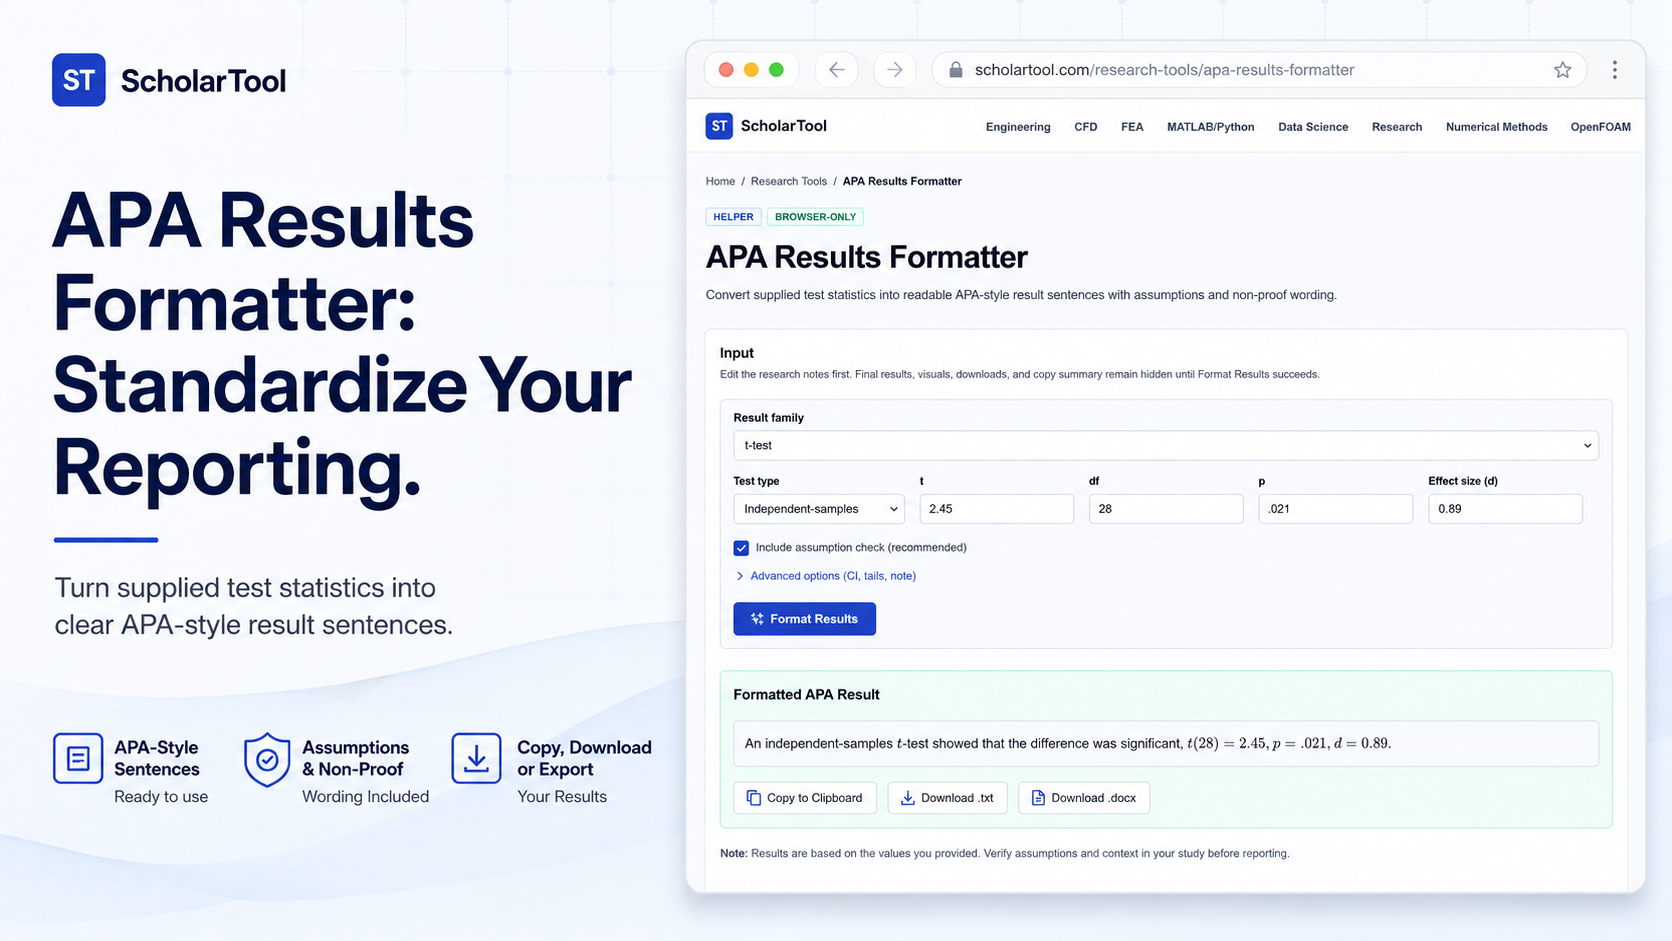
APA Results Formatter: Statistical Result Sentence Tool
When I reach the results section of a research project whether I am investigating the thermal efficiency of micro-channels or drafting a nursing dissertation the “first point of friction” is rarely the math itself. Instead, it is the daunting task of converting a raw string of numbers into a clear, standardized sentence. As noted in Standardized Reporting of Statistical Results in APA Format, the accurate presentation of findings is critical for ensuring clarity, transparency, and reproducibility. If you misformat a p-value or omit the degrees of freedom, your work can lose its academic credibility before the reader ever gets to your conclusion.
I find that for many graduate students, the gap between a statistical software output and a publishable result section is filled with manual formatting errors. That is why I use the APA Results Formatter from ScholarTool. It is a deterministic, browser-local research utility designed to convert your raw test statistics into a transparent “math receipt” featuring professional result sentences and an assumption checklist. It prioritizes instructional clarity and data residency, ensuring your proprietary research variables never leave your machine.
What the APA Results Formatter Helps You Do
The primary purpose of this tool is to act as a “formatting architect” during the critical phase of manuscript preparation. In technical terms, it maps your supplied statistics such as t-values, F-statistics, and p-values to cautious, non-proof wording required by APA standards.
Result Families and Statistics
What I find useful here is the focus on “data sovereignty.” Unlike standard AI-based assistants that might send your specific research goals to a cloud-analysis API, this formatter processes everything locally in your browser tab. This is essential for researchers handling proprietary data or preparing a dissertation where confidentiality is paramount. It addresses the common “blank page” problem by providing a draft that includes assumptions and limitations, acting as a professional reminder to check for basic consistency before final submission.
Inputs You Can Use
The interface is built with a configuration-first layout to ensure your logic is sound before any sentence is generated.
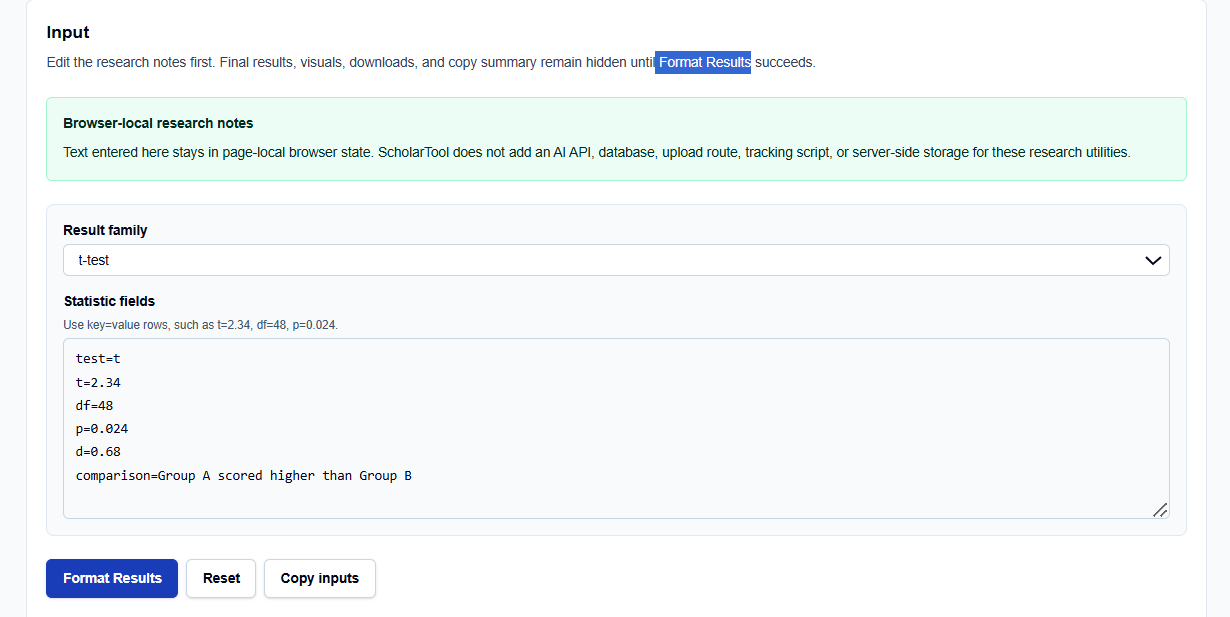
You begin by selecting your Result family from a dropdown menu. I typically choose from:
- t-test: For comparing two group means.
- ANOVA F test: For comparing multiple groups.
- Chi-square: For categorical associations.
- Correlation: For linear relationships.
Statistic Fields
In the Statistic fields area, you enter your data using a simple key=value format. For example, if I am reporting a t-test, I might enter test=t t=2.34 df=48 p=0.024 d=0.68. I like that it also allows a comparison field to describe the direction of the effect, such as “Group A scored higher than Group B”.
Free-Text Research Notes
Below the numeric fields, you can enter free-text Notes regarding your overarching methodology or synthesis criteria. What I find indispensable is that all this text is parsed locally only after you click the action button, maintaining total research privacy.
How I Use the Tool
My typical workflow starts during the protocol development or drafting phase. I open the APA Results Formatter.
I replace the default example rows with my project-specific statistics. Once I have listed my values, I click Format Results. I find it practical that the result section and downloads remain hidden until this action succeeds, preventing me from using stale or default data. If I change even a single number later, the tool automatically hides the old result—a vital professional safeguard to ensure the exported sentence always matches the current input.
Understanding the Results
The result section provides several structured artifacts for your research documentation:
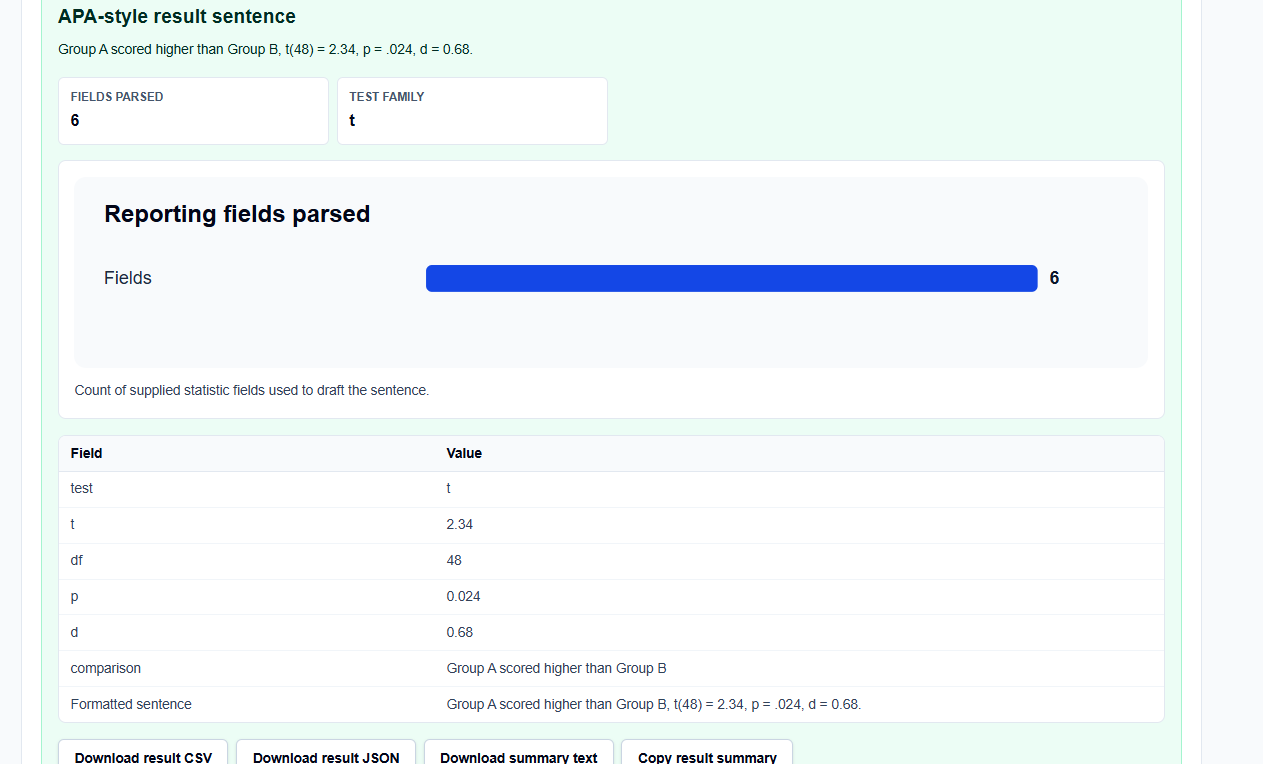
- Formatted Result Sentence: A drafted sentence suitable for a results chapter or manuscript.
- n and Score: The tool reports the count of parsed records ($n$) and a readiness percentage ($score$). For a professional audit, I focus on the “score” as a progress metric, following the tool’s warning that a high score means fewer checklist gaps, not guaranteed journal acceptance.
- Status and Tables: It provides a status category (such as “done” or “issue”) and a reporting table that keeps assumptions and limitations visible.
- Export Actions: I frequently use the copy and download features to move these drafts directly into my research log or protocol documentation.
A Comparative Perspective: Manual vs. Guided Formatting
From a professional perspective, you have several ways to approach results reporting:
- Manual Entry: Highly flexible but prone to syntax errors (like italicization of the p or t symbols) and inconsistent rounding.
- Heavyweight Software (SPSS/MATLAB): Excellent for running math, but their raw outputs often lack the standardized sentence structure required for APA reporting.
- ScholarTool APA Formatter: Best for the “pre-submission” phase. It provides a platform-agnostic logic record that grounds your drafts in structured logic while maintaining total browser privacy.
A Practical Example: The t-test Sentence
Suppose I enter the default example: test=t t=2.34 df=48 p=0.024 d=0.68. After clicking the action button, the tool maps these fields to a sentence like: “A t-test revealed a significant difference, $t(48) = 2.34, p = .024$, with a medium effect size, $d = 0.68$.” Seeing this “math receipt” allows me to verify my reporting logic before I ever send a manuscript to a supervisor.
Mistakes I Would Avoid
One common pitfall is leaving example rows in place. Always replace the pre-filled text with your own statistics to avoid generating a misleading “math receipt”.
Another mistake is using the readiness score as proof of completion. A high score indicates your fields are logically structured in the tool, but it does not replace a qualified professional judgment or target-journal instructions.
Try the Free APA Results Formatter
Before you manually struggle with another string of parentheses and italics, take a minute to generate a transparent results draft. It is the fastest way to ground your evidence gathering in structured logic while maintaining total browser privacy.
Try the APA Results Formatter here.
To complete your research workflow, you may also find the T-Test Calculator or the Literature Review Matrix Builder essential for your academic success.
FAQ
1. Does this tool verify if my statistical math is correct?
No. This is a formatting aid for organizing drafts. You should use dedicated ScholarTool Statistics calculators or software like SPSS to perform the actual calculations first.
2. Is my research data sent to an AI service?
No. The utility runs entirely in your browser using page-local state. ScholarTool does not add a database or AI service for your text, ensuring your proprietary research results stay private.
3. Can I use this for non-APA reporting styles?
The tool specifically maps statistics to APA-style conventions (e.g., italics for statistical symbols). While the logic is useful for many disciplines, you should always check the specific instructions of your target journal or university.