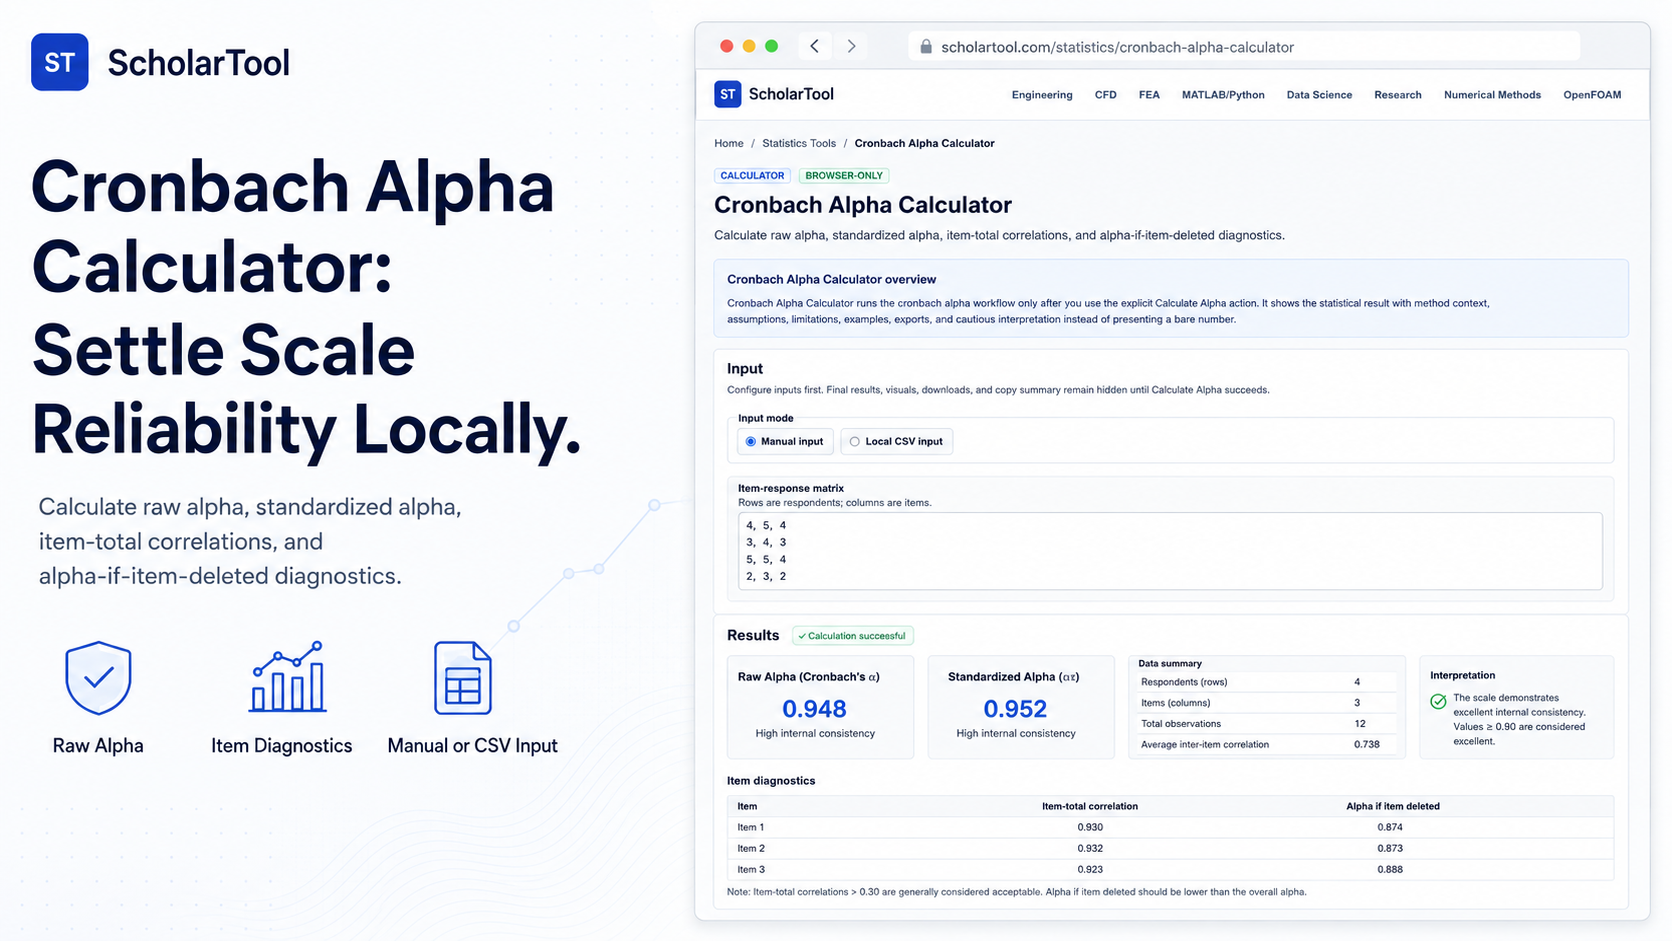
Cronbach Alpha Calculator: Private Scale Sizer
When transitioning a research project from survey coordinates to statistical reporting, establishing scale reliability is a major point of friction. Every researcher must determine if questionnaire items consistently measure the same underlying construct before making final reports. Staring at draft tables and guessing whether your survey responses are cohesive without an auditable planning receipt risks underpowering your analysis or presenting unreliable scales.
To solve this questionnaire bottleneck with high accuracy and complete privacy, I use the Cronbach Alpha Calculator from ScholarTool. This browser-local utility estimates scale reliability, standardized parameters, item-total correlations, and alpha-if-item-deleted diagnostics. Because all calculations execute entirely in your local browser tab using client-side TypeScript logic, your proprietary datasets, survey responses, and research files are never uploaded to any external database, ensuring 100% data sovereignty.
What the Cronbach Alpha Calculator Helps You Do
The primary purpose of this tool is to act as an exploratory data analysis takeoff aid during early research planning and verification. Rather than forcing you to configure heavy programming environments or pay for expensive software, it organizes reliability parameters into a clear, structured framework.
What I find useful here is how the tool keeps input preparation separate from final outputs. It does not run calculations automatically while typing, preventing annoying lags on larger datasets. Instead, the results update only when clicking calculate, allowing rapid sensitivity checks on item variances and total scale variance. This helps you quickly assess internal consistency before committing to heavy multivariate models.
Inputs You Can Use
The ScholarTool interface features a configuration-first layout to ensure your statistical assumptions are sound before any calculations are performed:
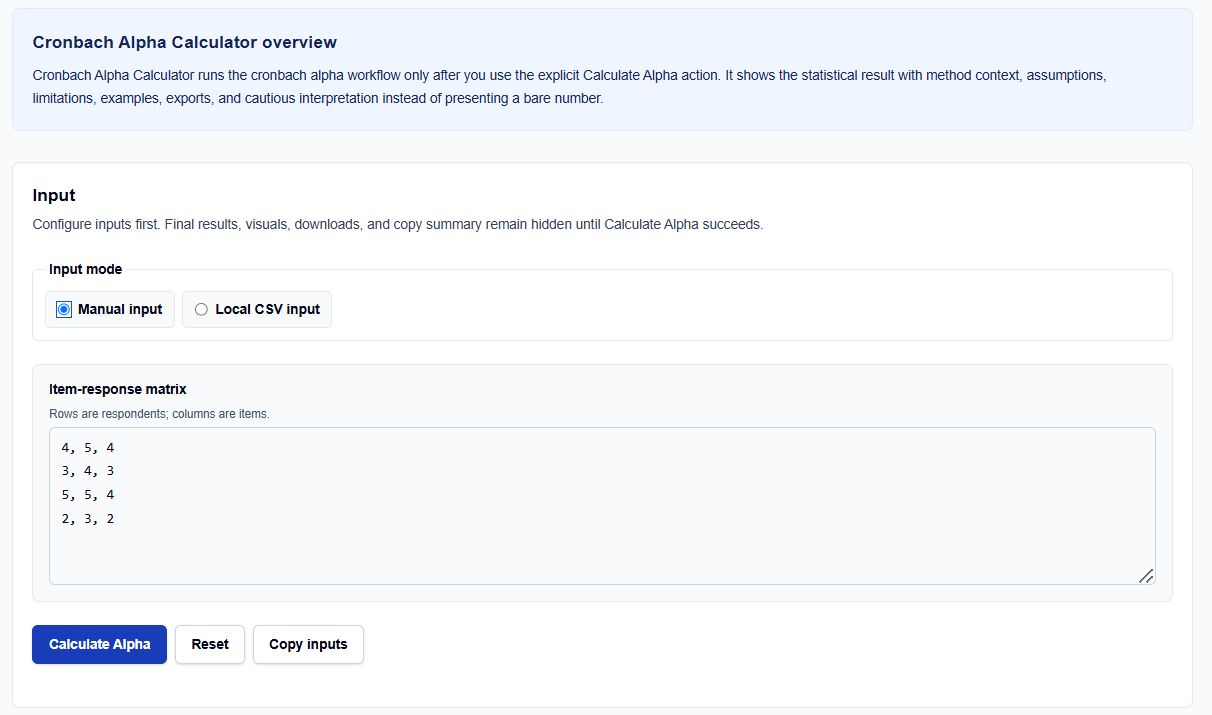
- Input Mode: You can choose manual numeric entry or loading a local CSV file directly to match your raw source sheets.
- Item-Response Matrix: If your data is available in this form, paste your raw numeric values directly into the text area. The tool expects rows to represent individual respondents and columns to represent questionnaire items.
- Method Options: You can choose options such as significance level, confidence level, variance convention, group mode, or selected columns to customize the calculation to your research plan.
How I Use the Tool
I open the Cronbach Alpha Calculator. First, select the input mode matching your data-gathering framework.
When I enter raw survey data into the item-response matrix text area, I verify that each respondent’s answers are placed on a separate row, separated by commas or spaces. Next, you can choose to adjust variance conventions or focus on specific columns. Once set, I click Calculate Alpha. All output summaries, item tables, and copy features remain completely hidden until this action succeeds. If you edit any numeric value afterward, results automatically hide to prevent stale data errors.
Understanding the Results
The result section helps you verify your questionnaire’s consistency by presenting several structured parameters:
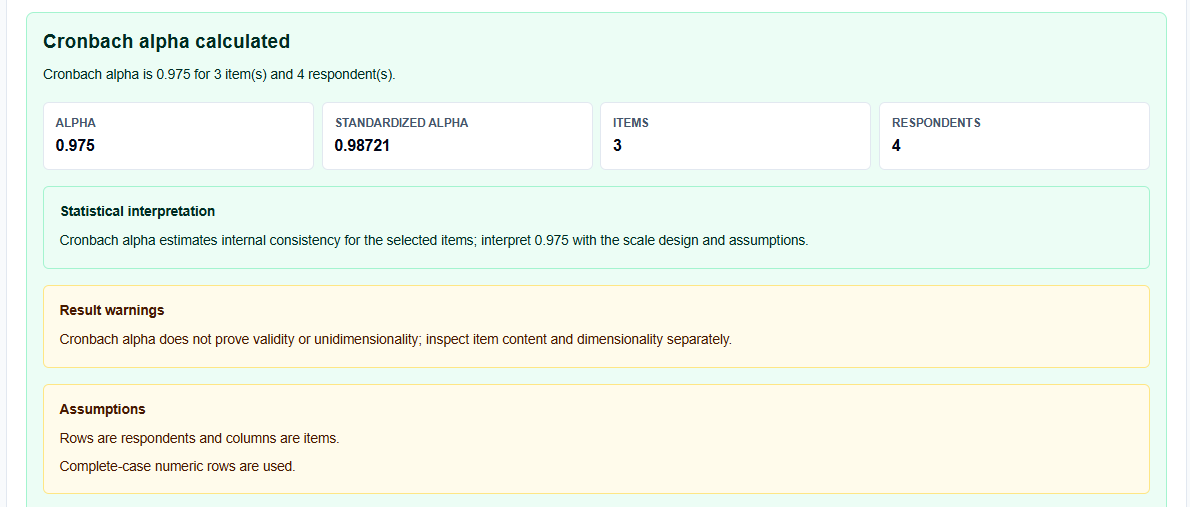
- Raw Cronbach Alpha: Reports the primary reliability estimate. It evaluates the ratio of item covariances to total score variance using the formula: \[alpha = \frac{k}{k – 1} \left( 1 – \frac{\sum s_i^2}{s_{\text{total}}^2} \right)\text{}\] where \(k\) is the number of items, \(s_i^2\) represents individual column variances, and \(s_{\text{total}}^2\) is the total scale variance.
- Standardized Alpha: Standardizes item responses to account for scale variance differences across questionnaire items.
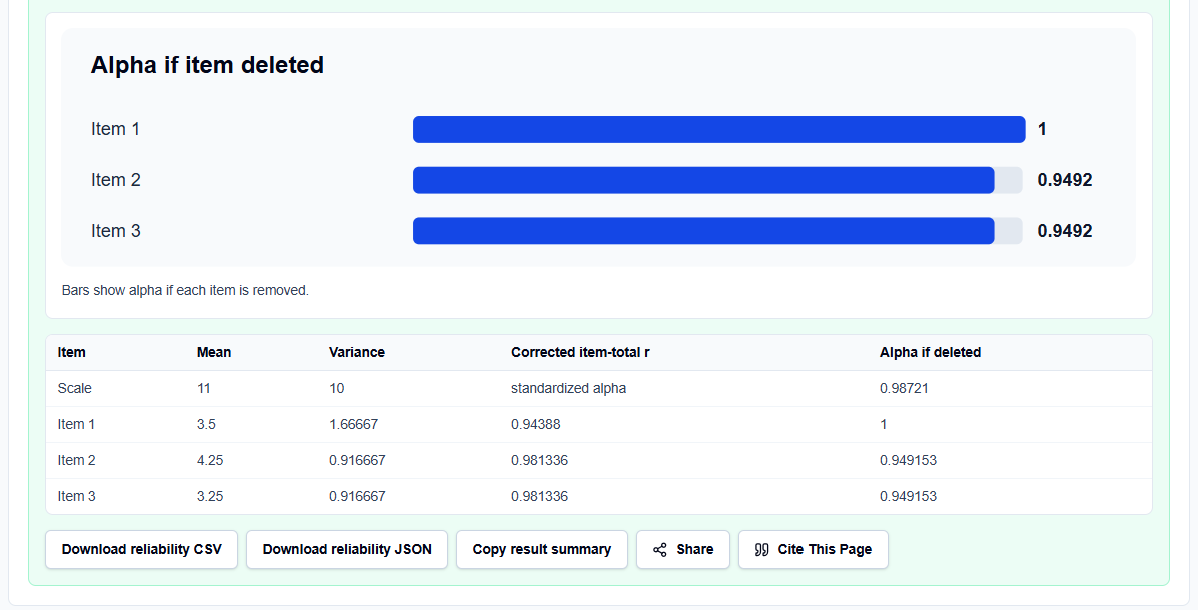
- Alpha if Item Deleted Table: Recalculates alpha after excluding each column one at a time, highlighting whether a removed item raises or lowers the overall scale consistency.
A Practical Example: The Three-Item Questionnaire
Consider a realistic check of a three-item survey with four respondents. We enter: 4, 5, 4 3, 4, 3 5, 5, 4 2, 3, 2
Upon clicking Calculate Alpha, the tool treats rows as respondents and evaluates:
- Intermediate Sums: Each respondent’s total is computed as the row sum (yielding totals of 13, 10, 14, and 7).
- Variances: Computes item variances by column and evaluates the total-score variance across the four cases.
- Final Result: The calculator reports raw alpha alongside item diagnostics, helping you assess internal consistency.
Mistakes I Would Avoid
One critical mistake is interpreting a high alpha as proof of unidimensionality. Cronbach’s alpha measures internal consistency, but it does not prove that a scale is unidimensional or that your items measure a single construct.
Another major pitfall is ignoring reverse-scored items. If some items are worded negatively, you must handle reverse scoring before entering data; otherwise, item variances will cancel out, artificially deflating your alpha.
Try the Free Cronbach Alpha Calculator
To eliminate manual errors and protect your survey files, try the tool today. It is free, secure, and runs locally.
Try the Cronbach Alpha Calculator on ScholarTool
Chaining this with our Descriptive Statistics Calculator or Correlation Significance Calculator supports related statistical workflows. You can also prepare files using Data Science CSV Tools or explore resources in our Research Tools category.
FAQ
1. What is a “good” Cronbach’s alpha value?
Thresholds depend on your construct, domain, and number of items. While 0.70 is often cited as a general rule of thumb, acceptable reliability must be evaluated based on professional judgment, measurement quality, and context.
2. Does a high Cronbach’s alpha prove that my questionnaire is valid?
No. Alpha is strictly a reliability estimate measuring internal consistency among selected items. It does not prove construct validity, unidimensionality, or that your items are actually measuring the intended concept.
3. Are my survey responses or CSV uploads transmitted to ScholarTool’s servers?
No. All manual response matrices and local CSV sheets are parsed and calculated entirely locally on your device within your browser’s page state. No records are sent to any external database or third-party analysis API.