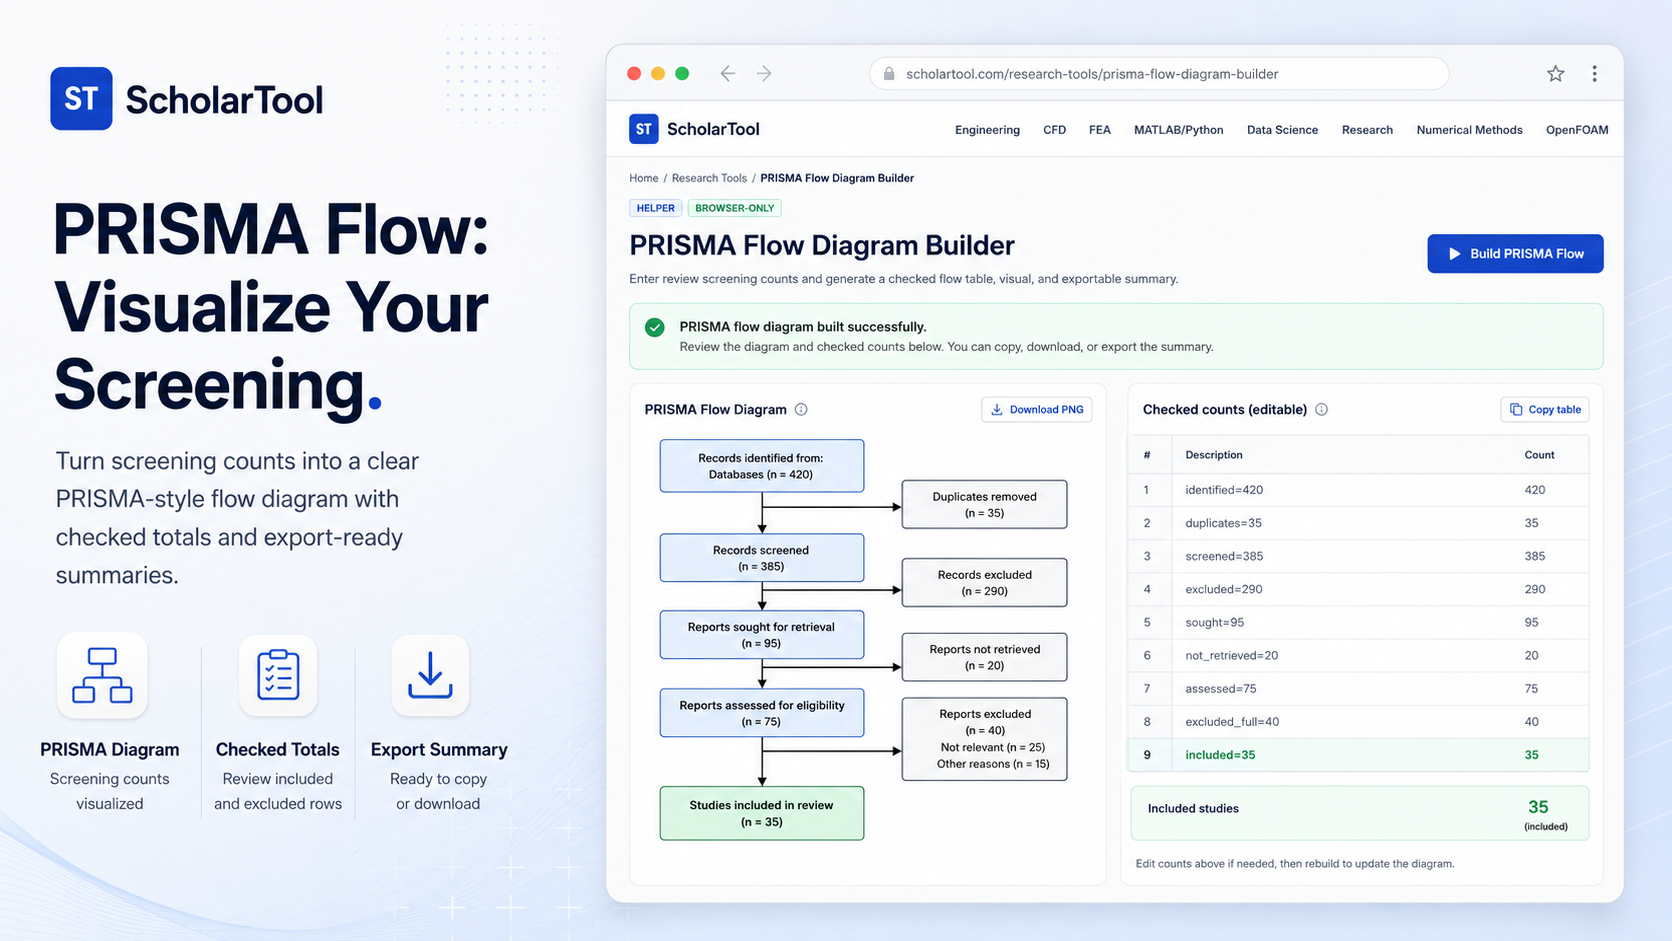
PRISMA Flow Diagram Builder: Online SLR Screening Tool
When I embark on a systematic literature review (SLR) whether I am investigating the thermal efficiency of micro-channels or mapping nursing interventions for patient safety the “first point of friction” in the reporting phase is the screening count. As noted in The Matrix Method of Literature Review, systematic reviews must be capability of capturing all possible results that relate to the topic of interest. To ensure transparency, you must keep track of and report the exact number of records captured and the details of the selection process. Staring at a pile of numbers (420 identified, 35 duplicates removed, 62 excluded after full-text review) and trying to force them into a clear narrative is a daunting task for any researcher.
I find that for many graduate students, the gap between gathering these counts and generating a publishable flow diagram is filled with manual drawing errors and inconsistent math. That is why I use the PRISMA Flow Diagram Builder from ScholarTool. It is a deterministic, browser-local research utility designed to convert your structured screening notes into a checked flow table, a visual diagram, and an exportable summary. It prioritizes instructional clarity and data residency, ensuring your proprietary research counts never leave your machine.
What the PRISMA Flow Diagram Builder Helps You Do
The primary purpose of this tool is to act as an organizational aid for reporting the study flow through the different phases of a review: Identification, Screening, Eligibility, and Inclusion. In technical terms, it performs a structured parse of your count data to build a PRISMA-style summary.
What I find useful here is the focus on “data sovereignty.” Unlike cloud-based assistants that might send your specific research protocol to an external API, this builder processes everything locally in your browser tab. I have verified that ScholarTool does not add a database or server-side storage for these utilities, which is essential when you are handling sensitive study counts for a dissertation or a confidential manuscript.
Inputs You Can Use
The interface is built with a configuration-first layout to ensure your logic is sound before any diagram is generated.
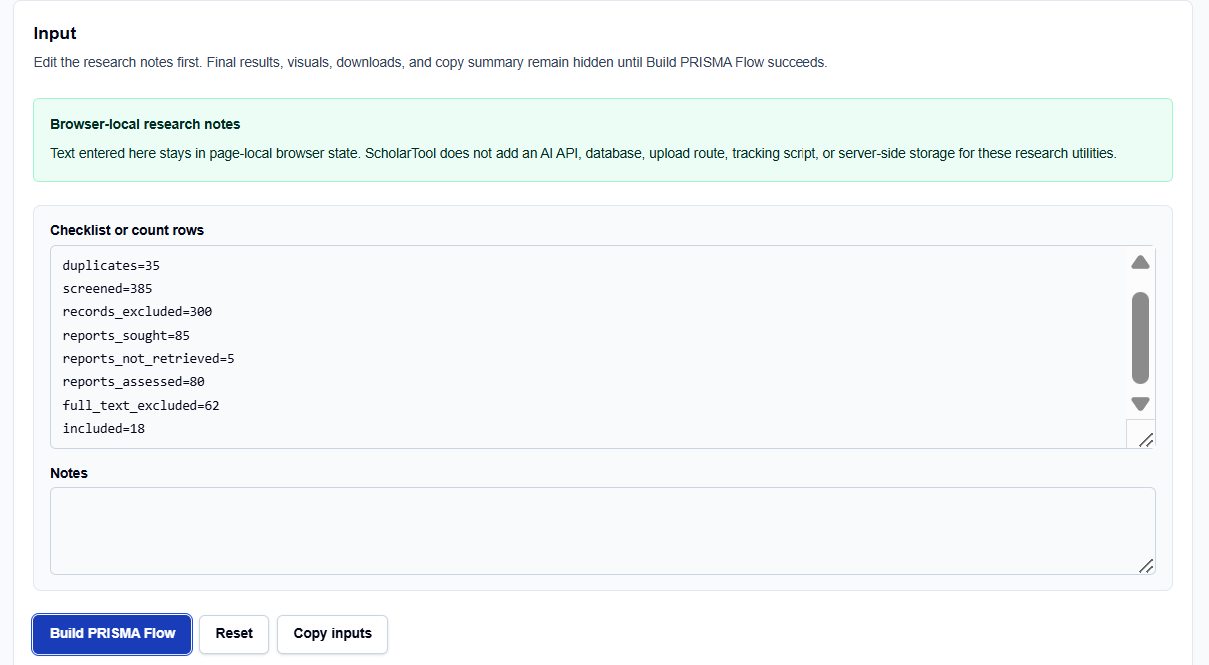
Screening Counts
In the Checklist or count rows field, you enter your data using a simple key-value format. I typically use the standard fields shown in the tool’s example:
- identified=X (Records found in databases)
- duplicates=X (Duplicate records removed)
- reports_assessed=X (Reports screened for eligibility)
- included=X (Studies included in the final synthesis)
Free-Text Notes
Below the counts, you can enter free-text Notes regarding your specific database choices or exclusion criteria. I find it practical that this text is only parsed locally after I click the action button, maintaining total research privacy.
How I Use the Tool
My typical workflow starts after I have completed my database searches and initial screening. I open the PRISMA Flow Diagram Builder.
I replace the default example rows with my project-specific counts. Once I have entered my identified, screened, and included values, I click Build PRISMA Flow. I find it practical that the results, visuals, and downloads remain hidden until this action succeeds, preventing me from acting on stale data. If I change even a single count row later, the tool automatically hides the old result a vital professional safeguard to ensure the output always matches the current input.
Understanding the Results
The result section provides three primary outputs for your research documentation:
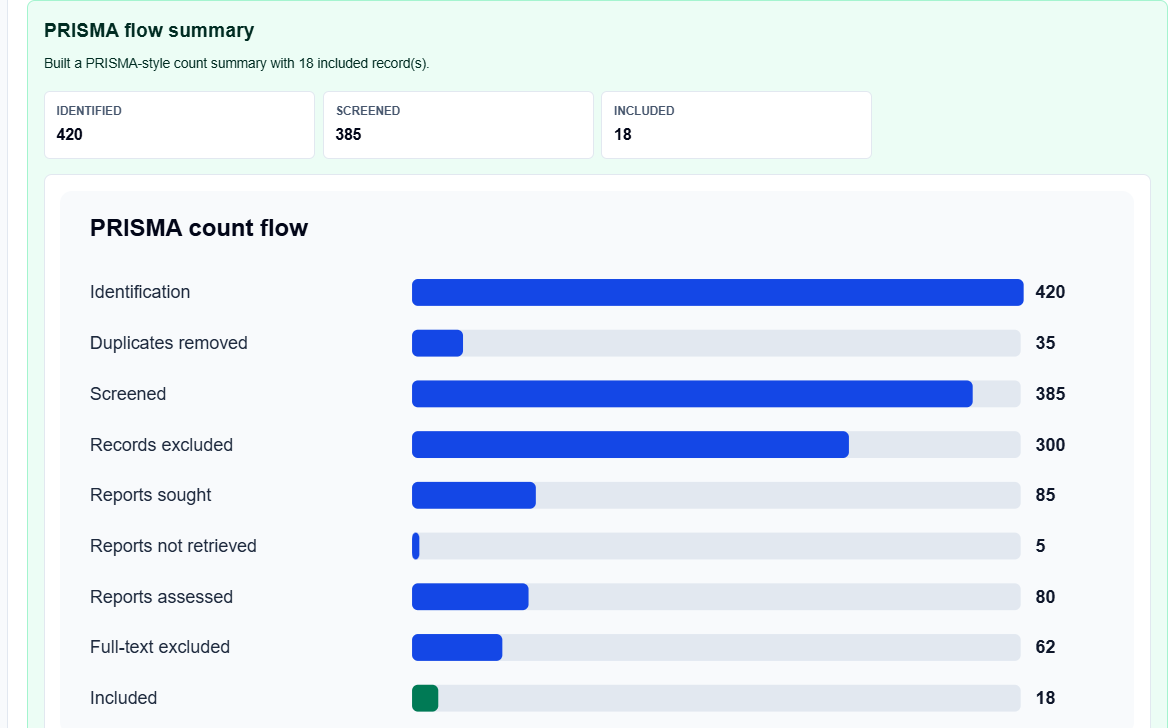
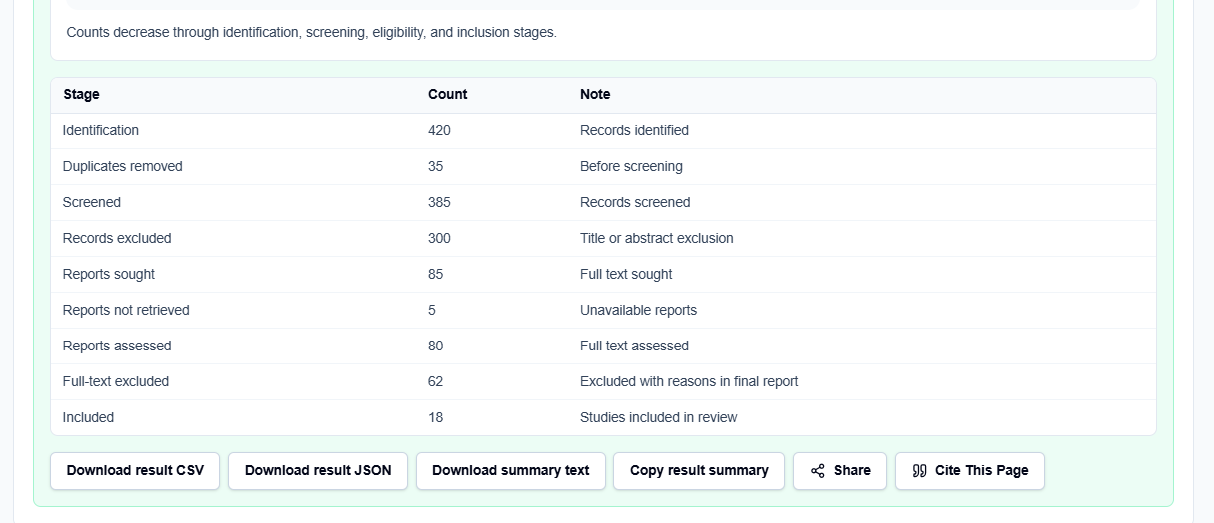
- PRISMA Count Table: A structured table identifying the juxtapositions between identification, screening, and inclusion.
- Flow Visual: A visual diagram tracking the numbers of documents identified, screened, and eligible.
- n and Score: The tool reports the count of parsed records ($n$) and a readiness percentage (score). For a professional audit, I focus on the “score” as a progress metric, following the tool’s warning that a high score means fewer checklist gaps, not guaranteed academic quality.
A Comparative Perspective: Manual Diagrams vs. Builder
From a professional perspective, you have a few ways to create flow diagrams:
- Standard Office Software (Word/PowerPoint): Highly flexible but prone to alignment errors and manual math mistakes.
- Official PRISMA Templates: The authoritative gold standard, but often requires a PDF editor or manual data entry into a static image.
- ScholarTool Builder: Best for the “planning and documentation” phase. it provides a “math receipt” for your counts and generates a checked summary that can be exported for a team review before final publication.
A Practical Example: The Default Example
Suppose I enter the tool’s prefilled example: identified=420 duplicates=35 screened=385 included=18. After clicking the action button, the tool applies the deterministic formula (included = reports assessed – full-text exclusions) to verify consistency. The tool returns a PRISMA count table and a screening summary ready for my research log.
Mistakes I Would Avoid
One common pitfall is leaving example rows in place. I always replace the pre-filled text with my own notes to avoid generating a “math receipt” for data that isn’t mine.
Another mistake is using the readiness score as proof of completion. A high score indicates your counts are logically structured in the tool, but it does not replace a supervisor’s review or the final reporting format required by a target journal.
Try the Free PRISMA Flow Diagram Builder
Before you manually struggle with drawing boxes and arrows in a document, take a minute to generate a transparent screening flow. It is the fastest way to ground your evidence tracking in structured logic while maintaining total browser privacy.
Try the PRISMA Flow Diagram Builder here.
To complete your research workflow, you may also find the SLR Search String Builder or the Literature Review Matrix Builder essential for your academic success.
FAQ
1. Does this tool automatically find studies for me?
No. This is a builder for organizing your existing screening counts. You should conduct your search in databases like PubMed or Scopus first, then enter the resulting numbers into the tool to generate the diagram.
2. Is my research text sent to a database?
No. The utility runs entirely in your browser using page-local state. ScholarTool does not add a database, API upload route, or AI service for your research text, ensuring your proprietary counts stay private.
3. Why do the results disappear when I edit a count?
The tool is designed to prevent “stale” or misleading artifacts. If you change your inputs, the old visual is hidden until you click “Build PRISMA Flow” again, ensuring that your exported summary always matches your latest data.