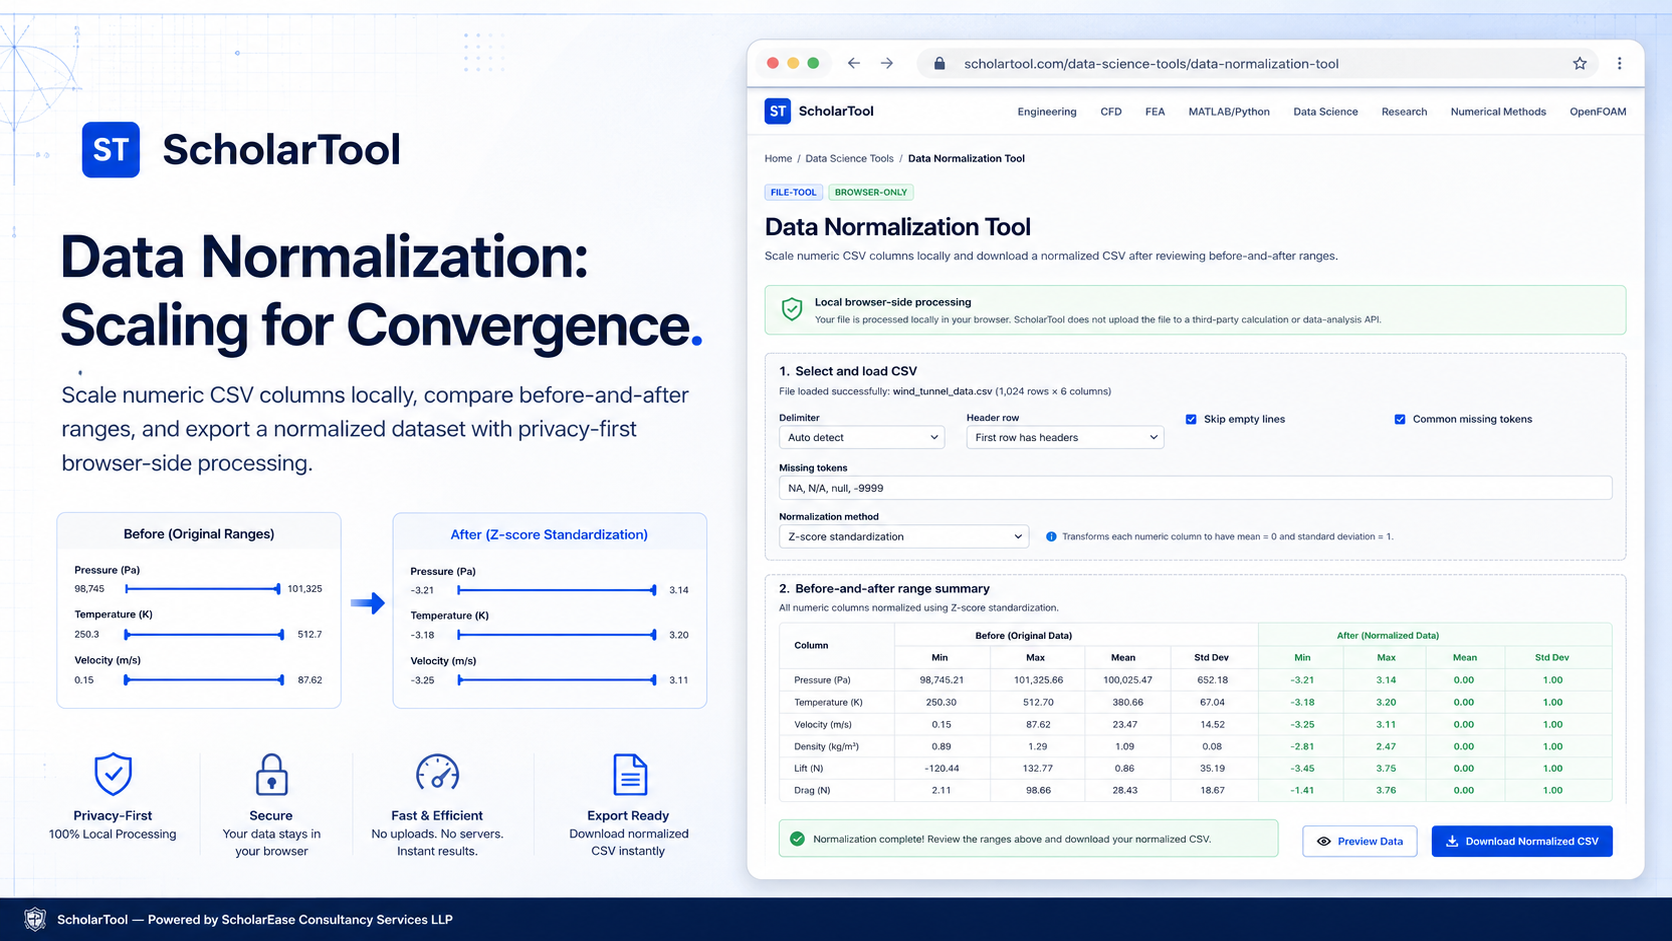
Data Normalization Tool: Online CSV Scaling & Standardization
When I start a new data science project whether I am analyzing sensor readings from a lab or processing a repository of transaction records I have to act like a detective. As noted in An Introduction to Data Science, data are the raw materials at the foundation of the information pyramid. However, the usefulness of those materials depends heavily on “garbage in, garbage out”. If one variable is measured in thousands (like income) and another in single digits (like age), many machine learning algorithms will incorrectly prioritize the larger numbers.
I find that the most time-consuming aspect of data science is this initial preparation phase. While I could write Python scripts using Scikit-Learn to handle scaling every time, I often need a faster, more transparent way to screen and transform raw datasets before I begin formal modeling. That is why I use the Data Normalization Tool from ScholarTool. It is a deterministic, browser-local utility designed to give you a “math receipt” of your dataset’s transformation without the risk of uploading proprietary research to an external server.
What the Data Normalization Tool Helps You Do
The primary purpose of this tool is to bring all your numeric features to a common scale. In technical terms, it performs a first-pass normalization or standardization of selected CSV columns. As Scikit-Learn documentation suggests, scaling can significantly improve the convergence of gradient-based estimators.
What I find useful here is the focus on “data sovereignty.” Unlike standard AI-based parsers that send your files to a cloud-analysis API, this tool works entirely on the client side. It uses the Papa Parse library to handle CSV parsing right in your browser tab. This means your sensitive research values and proprietary column names never leave your machine.
Inputs You Can Use
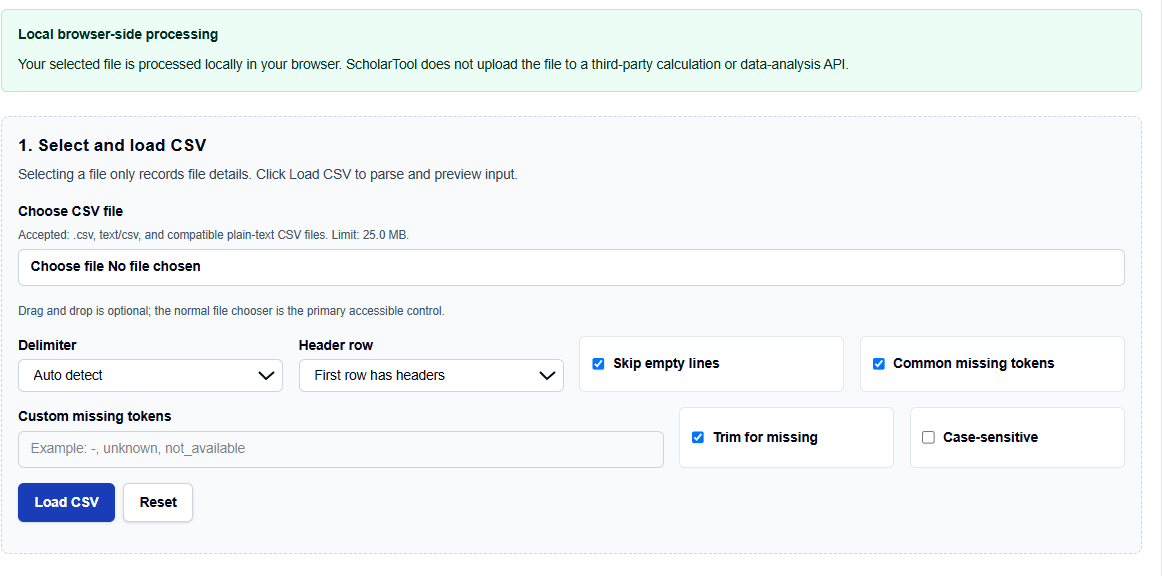
The interface is built with a configuration-first layout that ensures your data is read correctly before any math is applied.
Loading and Delimiters
You start by selecting your CSV file (up to 25.0 MB). I like that it doesn’t just assume a comma; you can choose Semicolon, Tab, or Pipe, or let the tool Auto detect the format. You can also toggle headers and specify Custom missing tokens. If your dataset uses “999” for nulls, configuring this here prevents those values from skewing your mean or standard deviation calculations.
Normalization Methods
Once your data is loaded, you choose your mathematical lens:
- Min-Max Scaling: Maps your data to a custom range, typically 0 to 1.
- Z-Score Standardization: Converts values to deviations from the mean measured in sample standard deviations. This is the principal model for traditional statistics.
- Robust Scaling: This is a professional favorite of mine. It subtracts the median and divides by the Interquartile Range (IQR), which reduces the sensitivity to outliers that would otherwise “pull” a standard Z-score.
- Max-Absolute Scaling: Scales each feature by its maximum absolute value, which is particularly useful for preserving sparsity in your data.
How I Use the Tool
My typical workflow begins when I receive a fresh, uncleaned CSV. I open the Data Normalization Tool.
After loading the file, I review the column list. I find it practical that the results and visuals remain hidden until I click Normalize Data. I select the columns that represent physical measurements for example, Height or Weight. I avoid scaling identifier columns, as scaling a “User ID” is a classic common mistake that adds no physical meaning to the data. If the tool identifies a Constant column, it issues a warning and applies a safe fallback value to prevent “division by zero” errors.
Understanding the Results
The result section provides a preview of the Normalized Data first, identifying the new ranges for every selected column. For a professional audit, I focus on:
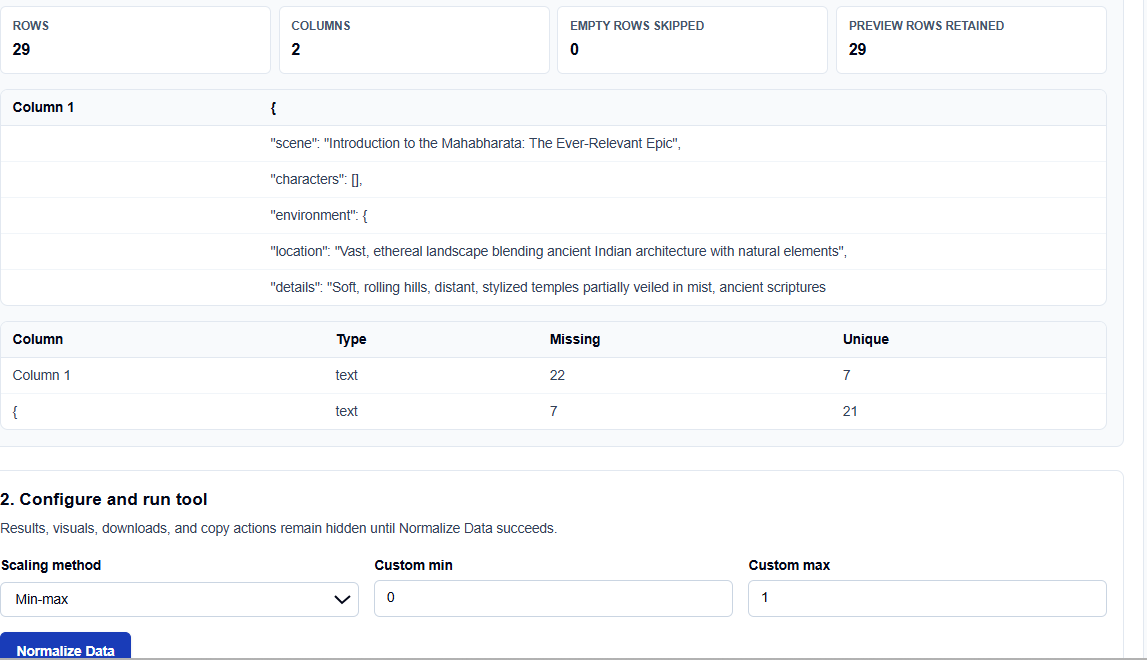
- Before-and-After Comparisons: This helps me verify that the transformation has correctly mapped the values to the intended target (like the 0–1 range).
- Downloadable Result: I frequently use the export feature to download the scaled CSV for downstream modeling experiments.
- Readiness Signal: If I am performing a preliminary preparation, seeing the standardized distribution helps me decide if I need to use more advanced methods like reproducing kernel Hilbert spaces for non-linear relationships.
A Practical Example: The Sensor CSV
Suppose I load a sensor dataset where Pressure ranges from 100 to 1000 and Temperature ranges from 20 to 30. If I run a clustering algorithm on this raw data, Pressure will dominate. By using the Z-score standardization mode, I notice that both columns are transformed to have a mean of 0 and a standard deviation of 1. This “math receipt” allows me to proceed with my analysis knowing that each physical dimension is contributing equally to the model’s distance calculations.
Mistakes I Would Avoid
One common pitfall is ignoring outliers before min-max scaling. A single extreme value can “squish” the rest of your data into a tiny range near zero. I always check for anomalies using the Outlier Detector before deciding which scaling method to use.
Another mistake is scaling test data separately from training data. For formal research, you should fit your scaling parameters on the training set only to avoid data leakage. I use this tool primarily for preliminary data preparation and educational estimation.
Try the Free Data Normalization Tool
Before you manually unroll standardization formulas in a spreadsheet, take a minute to generate a transparent scaling report. It is the fastest way to ground your preprocessing in verified statistical logic while maintaining total browser privacy.
Try the Data Normalization Tool here.
To complete your data science toolkit, you may also find the Train-Test Split Generator or the Categorical Encoding Helper essential for your workflow.
FAQ
1. What is the difference between normalization and standardization?
Normalization usually refers to mapping values to a specific range, such as 0 to 1 (Min-Max scaling). Standardization typically refers to Z-score scaling, where data is centered around a mean of 0 with a standard deviation of 1.
2. Should I scale my entire dataset at once?
For preliminary exploration, yes. However, for formal machine learning models, you should fit your scaling parameters on the training data only and apply those same parameters to your test set to prevent data leakage.
3. Are my research files uploaded to ScholarTool?
No. All processing is performed locally in your browser using JavaScript and the File API. ScholarTool does not submit your data to any third-party calculation or storage API.