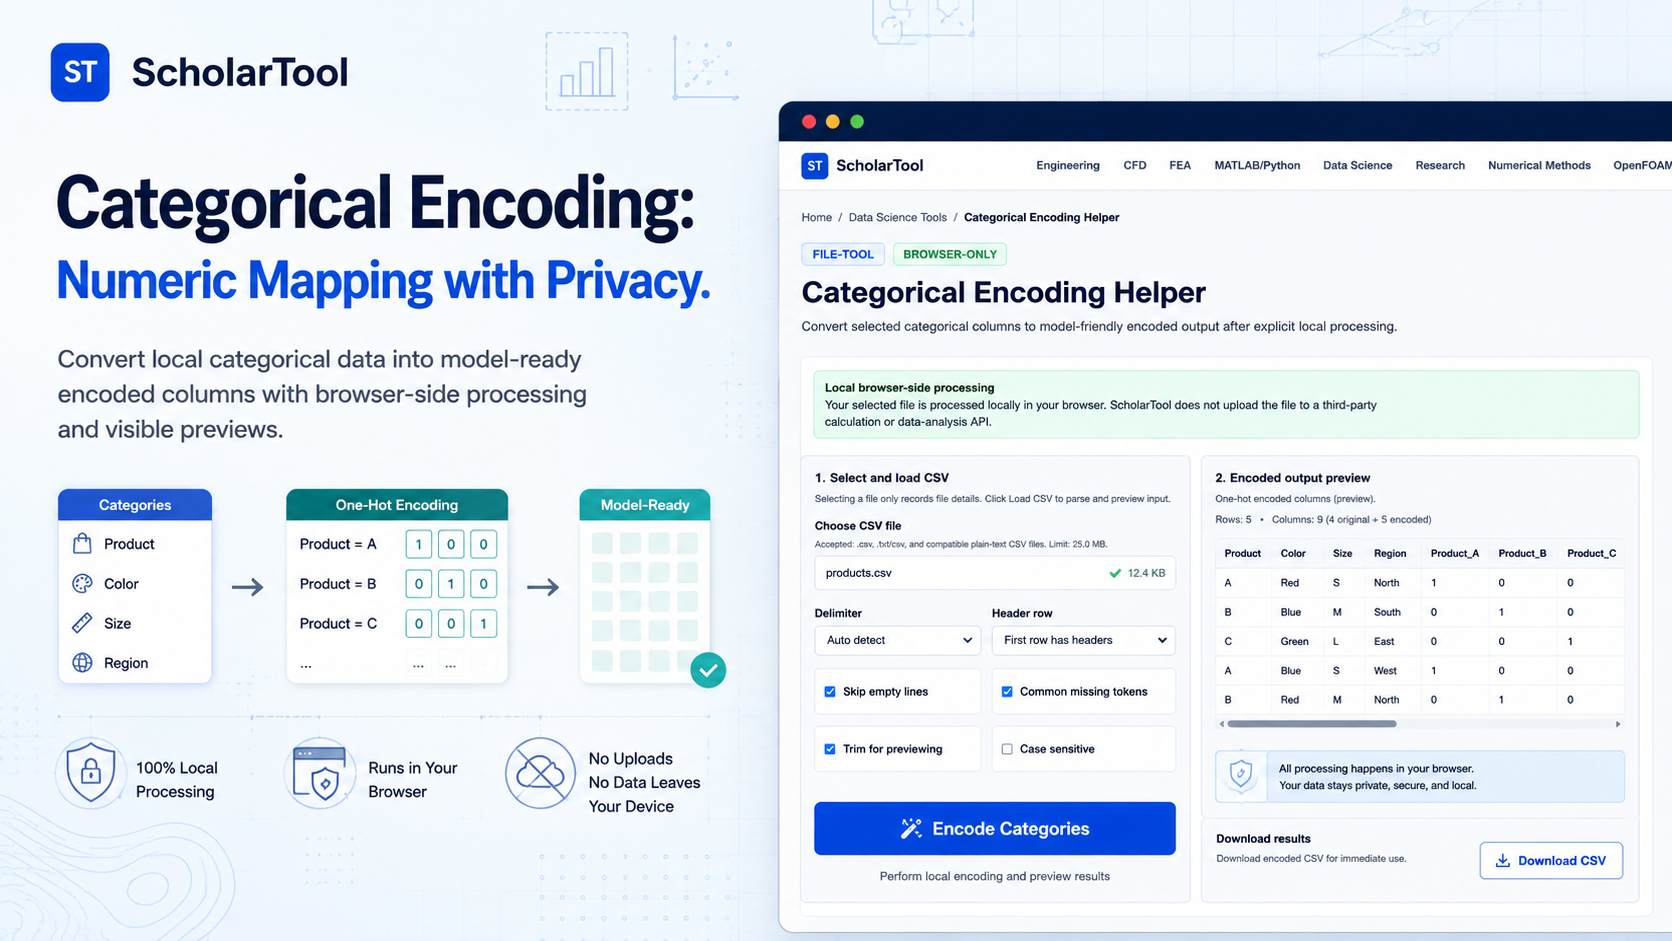
Categorical Encoding Helper: One-Hot & Label Encoding
When I start a new machine learning project whether I am classifying iris species or predicting credit approval the most persistent hurdle is often the “text” in my dataset. As noted in Data Science and Machine Learning, many algorithms are designed to process arrays of numbers, not text labels like “Red,” “Green,” or “Single”. If you don’t transform these qualitative features into a numeric format, your model matrix will be physically incomplete or lead to “type” errors in your Python or R scripts.
What I find indispensable for this preprocessing phase is the Categorical Encoding Helper from ScholarTool. It is a deterministic, browser-local utility designed to give you a “math receipt” of your category transformations without the risk of uploading proprietary research to an external server. It prioritizes instructional clarity and data residency, ensuring that your case-specific labels stay on your machine while you prepare them for your learner.
What the Categorical Encoding Helper Helps You Do
The primary purpose of this tool is to help you move from raw qualitative data to a model-friendly rectangular dataset. In technical terms, it performs a first-pass conversion of non-numeric columns into integers or indicator variables.
What I find useful here is the focus on “data sovereignty”. Unlike standard cloud-based parsers that send your files to a third-party AI or storage API, this helper works entirely on the client side. It uses Papa Parse to handle the heavy lifting of CSV parsing right in your browser tab. This means your proprietary column names and internal research variables never leave your computer. Additionally, the tool provides critical safeguards, such as warning you about high-cardinality columns that could lead to overfitting or an excessively wide sparse table.
Inputs You Can Use
The interface is built with a configuration-first layout to ensure your data is parsed correctly before you ever commit to an encoding strategy.
Loading and Delimiters
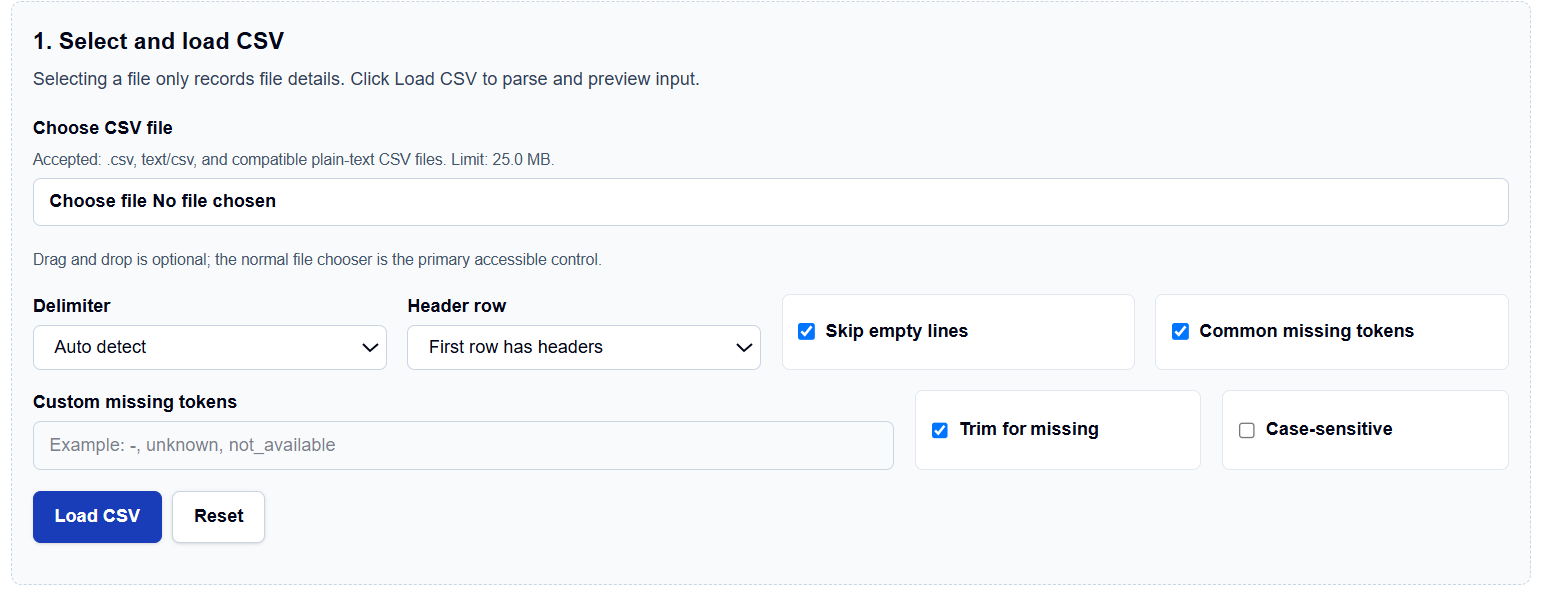
You begin by selecting your CSV file, which has a strict limit of 25.0 MB to maintain browser stability. I like that it offers an Auto detect delimiter mode but also allows me to explicitly choose Semicolon, Tab, or Pipe. If your file lacks headers, you can uncheck the Header row toggle to ensure the tool doesn’t misidentify the first instance as metadata.
Custom Token Detection
A professional feature I frequently use is the Custom missing tokens field. As we know from data science fundamentals, missing data isn’t always labeled as “NA”; it might be coded as “null” or “999”. The tool allows you to define these tokens and even toggle Case-sensitive matching to ensure they are handled correctly during the type-inference phase.
How I Use the Tool
My typical workflow begins after I have performed initial data cleaning but before I have partitioned my data for training. I open the Categorical Encoding Helper.
Once I have loaded the file, I review the column list and select the non-numeric features I want to encode. I find it practical that the results, visuals, and download options remain hidden until I click Encode Categories, preventing me from acting on stale or default data. I then review the encoded preview; if I am using a linear model, I often choose the “drop-first” one-hot variant to avoid the dummy-variable trap, where redundant columns can lead to multi-collinearity.
Understanding the Results
The result section provides the Encoded CSV download first, identifying the transformed columns based on your chosen method. For a professional audit, I focus on:
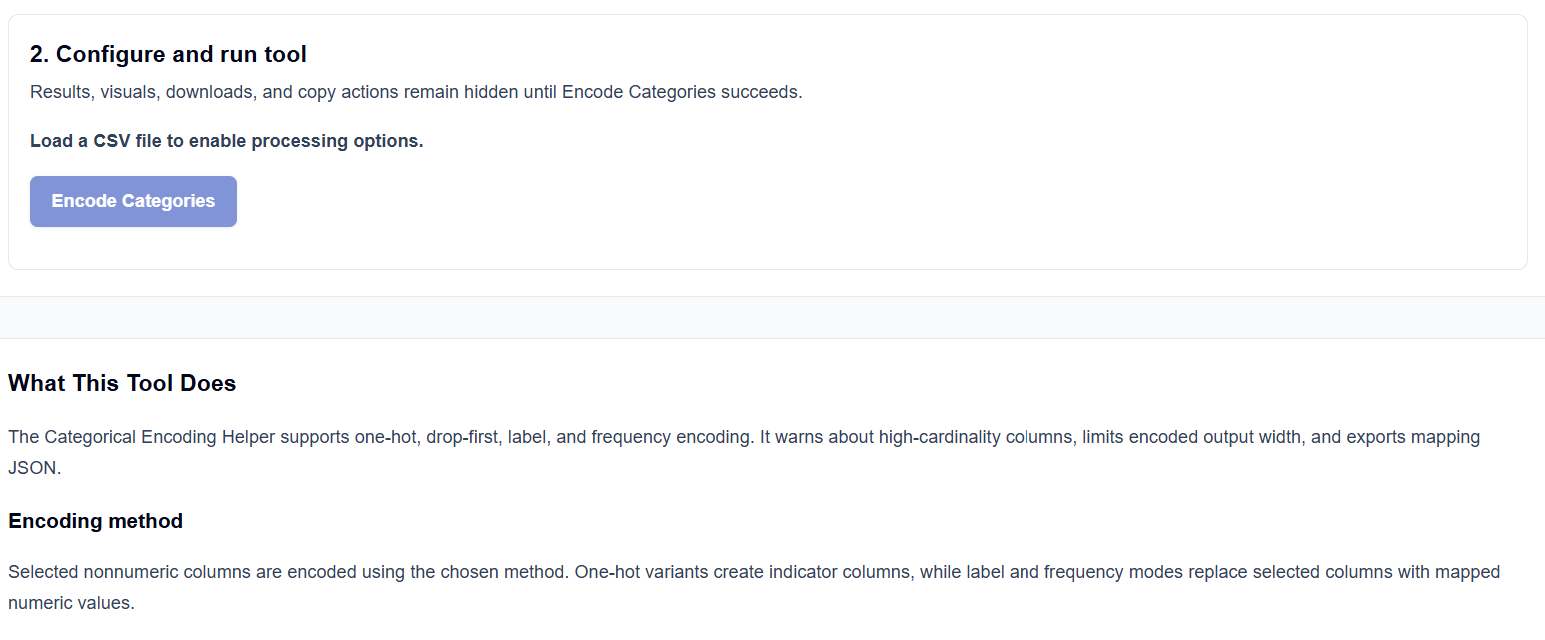
- One-Hot Encoding: This creates indicator columns where each category gets a 1 or 0 column, which is essential for nominal features like “eye color” where no order exists.
- Label and Frequency Encoding: These replace categories with integers or counts, which is useful when you have a high number of labels and want to avoid an excessively wide dataset.
- Mapping JSON: I frequently export the mapping JSON to ensure I have a record of exactly which integer corresponds to which text label for my final research documentation.
A Practical Example: The Product Dataset
Suppose I load a product dataset with a region column (East, West, North, South) and a product_type column. After clicking the action button, I choose One-hot encoding for the region feature. The tool generates four indicator columns (or three if I select “drop-first”) and allows me to download the resulting CSV. This “math receipt” allows me to move directly to my training script in Python or R with a verified numeric baseline.
Mistakes I Would Avoid
One common pitfall is using label encoding for nominal categories. If you assign numbers like 1, 2, and 3 to colors, your model might incorrectly assume that “Green” (3) is “greater than” “Red” (1), which can lead to physically meaningless results.
Another mistake is encoding high-cardinality IDs. One-hot encoding a column with thousands of unique user IDs will create thousands of sparse columns, increasing the risk of overfitting. I always check the tool’s cardinality warning before proceeding.
Try the Free Categorical Encoding Helper
Before you manually write another line of encoding code in your Jupyter notebook, take a minute to generate a transparent numeric draft. It is the fastest way to ground your preprocessing in structured logic while maintaining total browser privacy.
Try the Categorical Encoding Helper here.
To complete your preprocessing toolkit, you may also find the Data Normalization Tool or the Train-Test Split Generator essential for your research workflow.
FAQ
1. What is the “dummy-variable trap”?
In some linear models, including indicator columns for all categories plus a constant intercept creates perfect multi-collinearity. Choosing the drop-first encoding mode helps avoid this by removing one redundant column.
2. Why is encoded output capped at 1,000 columns?
The browser-local workflow enforces a 1,000-column limit to prevent your browser from freezing during the encoding and rendering process, especially with high-cardinality data.
3. Are my proprietary CSV files uploaded to ScholarTool?
No. All processing happens locally on your machine using JavaScript. ScholarTool does not submit your file data to any third-party calculation or AI analysis API.