
Correlation Matrix Calculator: Pearson & Spearman Tool
When I start a new data science project whether I am analyzing the iris dataset or processing a repository of sensor readings the first hurdle is understanding how my variables interact. As noted in An Introduction to Data Science, finding relationships between sets of data is a key aim of the discipline. If two features are highly correlated, they might be redundant, leading to overfitting or inefficient models. However, raw datasets are rarely “ready to run.” I find that missing values and varying feature scales often cloud the initial exploratory data analysis (EDA).
What I find indispensable for this auditing phase is the Correlation Matrix Calculator from ScholarTool. It is a deterministic, browser-local utility designed to give you a transparent “math receipt” of your dataset’s internal relationships. It prioritizes instructional clarity and data residency, ensuring that your proprietary research values stay on your machine while you identify strong associations.
What the Correlation Matrix Calculator Helps You Do
The primary purpose of this tool is to help you move from a collection of raw features to a structured map of statistical dependencies. In technical terms, it performs a pairwise inspection of numeric columns to identify linear or monotonic trends.
I find the interface particularly helpful because it addresses the “privacy gap” in modern web tools. Unlike standard AI-based parsers that might send your CSV to a cloud-analysis API, this calculator processes every cell locally using your browser’s internal logic. This means your case-specific column names and proprietary data points never leave your computer. What I appreciate most is the tool’s ability to handle the “messy” side of statistics, such as identifying constant columns that would otherwise crash a script by causing a division-by-zero error.
Inputs You Can Use
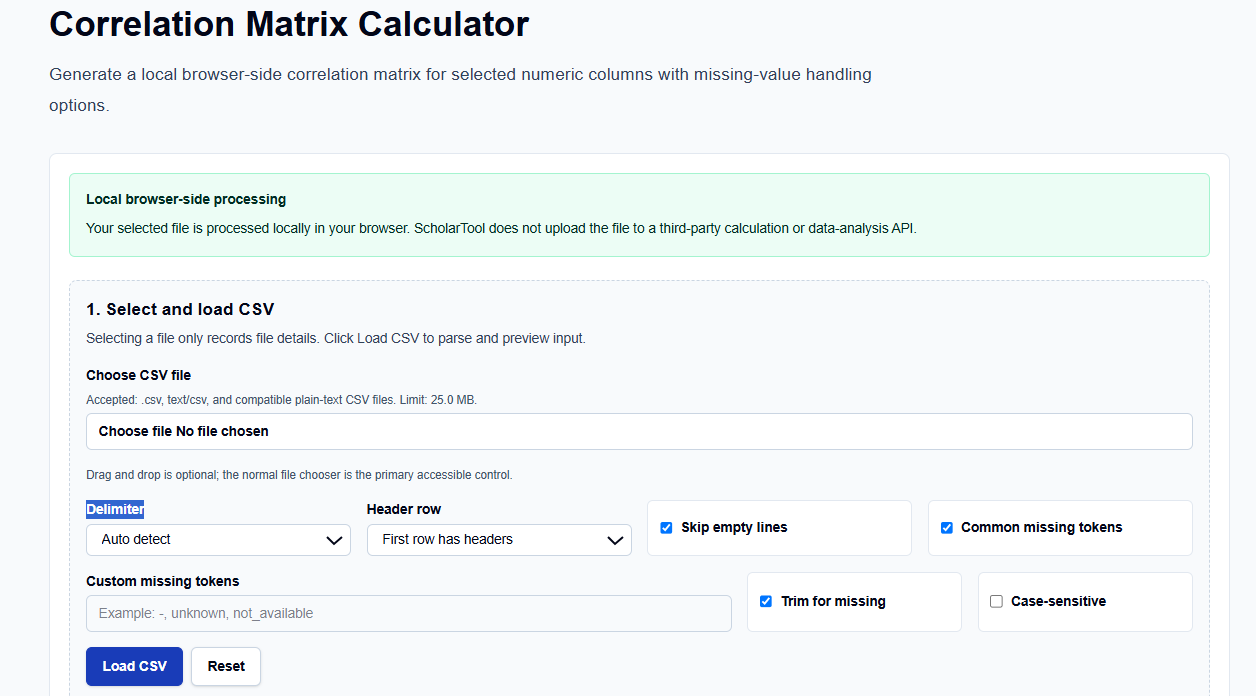
The interface is built with a configuration-first layout that ensures your data is read correctly before any calculations begin.
Loading and Delimiters
You start by selecting your CSV file (up to 25.0 MB). I like that it doesn’t just assume a comma delimiter; you can choose Semicolon, Tab, or Pipe, or let the tool Auto detect the format. You can also toggle whether your First row has headers orinstruct the tool to Skip empty lines.
Custom Missing Tokens
A professional feature I frequently use is the Custom missing tokens field. As we know from data science fundamentals, missing data might be coded as “N/A”, “null”, or even custom strings like “999”. The tool allows you to define these tokens before you run the analysis, ensuring your pair sample sizes are accurate. You can even toggle Case-sensitive matching or instruct the tool to Trim whitespace for missing checks.
Correlation Methods
Once your data is loaded, you choose your mathematical lens:
- Pearson Correlation: Measures the linear association between numeric values. I use this when I expect a “straight-line” relationship.
- Spearman Correlation: Computes correlation on tied ranks. I find this essential for non-linear but monotonic relationships, where variables move together but not at a constant rate.
How I Use the Tool
My typical workflow begins when I receive a fresh, uncleaned CSV. I open the Correlation Matrix Calculator.
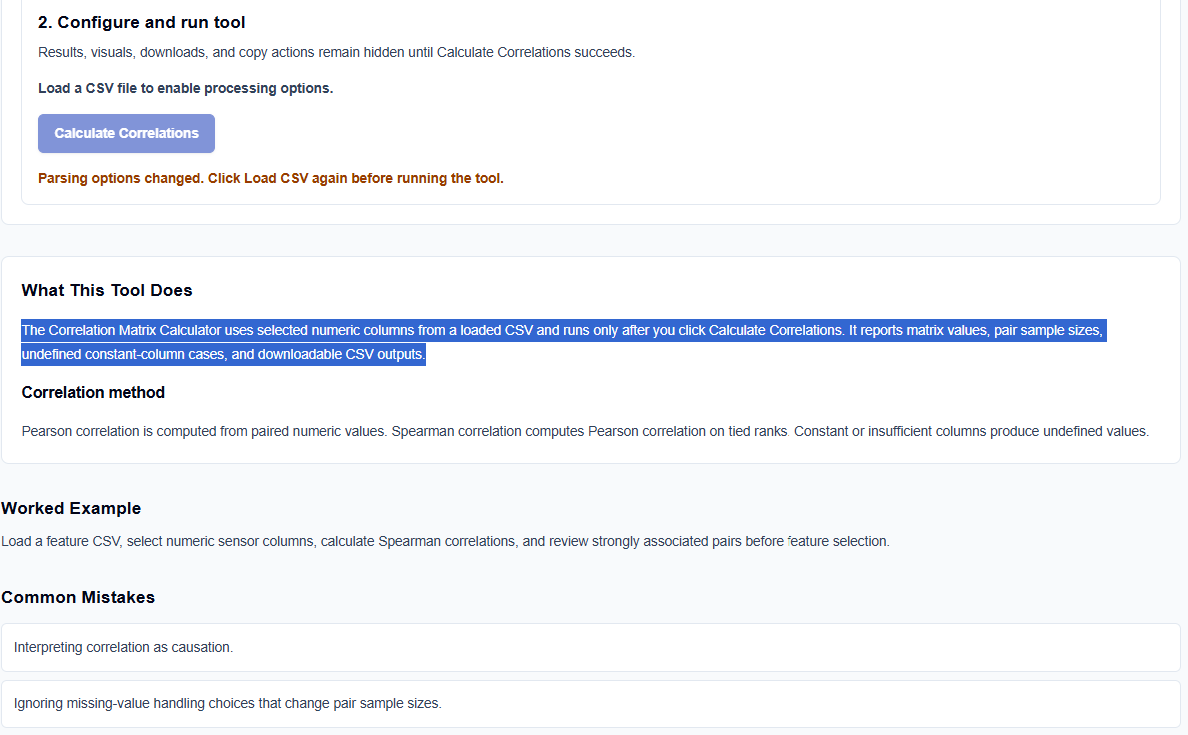
After loading the file, I review the column list and select the numeric features I want to audit. I find it practical that the results, visuals, and download actions remain hidden until I click Calculate Correlations. I then choose my Missing Value Handling. If my dataset has sparse entries, I might use Pairwise mode to maximize the data used for each pair. If I need a perfectly consistent sample across the entire matrix, I select Listwise mode, which only uses rows where every selected column is numeric.
Understanding the Results
The result section provides the Correlation Matrix first, mapping values from -1 to 1. For a professional audit, I focus on:
- Pair Sample Sizes: The tool reports how many rows were actually used for each calculation, which is vital for assessing the reliability of the result.
- Undefined Cases: It flags columns with zero variation (constant columns). This is a vital professional check because correlation divides by variation; if variation is zero, the result is mathematically undefined.
- Downloadable Result: I frequently use the export feature to download the final matrix as a CSV for my research documentation.
A Practical Example: The Sensor Audit
Suppose I load a sensor CSV with columns for Pressure, Temperature, and Output_Voltage. After selecting these and clicking the action button, I notice a Pearson correlation of 0.98 between Pressure and Output_Voltage. This high value acts as a professional signal that one of these columns might be redundant for my machine learning model. Seeing this “math receipt” allows me to streamline my feature selection before I ever open a Jupyter notebook.
Mistakes I Would Avoid
One common pitfall is interpreting correlation as causation. As the tool’s guidance reminds us, a high correlation suggests an association but does not establish cause and effect.
Another mistake is using Pearson correlation for non-linear data. If your relationship is curved (monotonic), Pearson may under-report the strength of the association. In those cases, I always toggle to the Spearman method.
Try the Free Correlation Matrix Calculator
Before you manually write another Python loop to check feature redundancies, take a minute to generate a transparent relationship audit. It is the fastest way to ground your preprocessing in verified statistical logic while maintaining total browser privacy.
Try the Correlation Matrix Calculator here.
To complete your data science toolkit, you may also find the CSV Data Profiler or the Outlier Detector essential for your workflow.
FAQ
1. What is the difference between Pearson and Spearman correlation?
Pearson measures linear association—how well data fits a straight line. Spearman measures monotonic association by correlating the ranks of the data, making it better for non-linear relationships.
2. Why does my result show “Undefined”?
Correlation is calculated by dividing by the variation in the data. If a column is constant (every value is the same), it has zero variation, making the denominator zero and the correlation undefined.
3. Is my dataset uploaded to ScholarTool?
No. All processing is performed locally in your browser using the File API. Your data is read and calculated within your browser tab and is never sent to an external server or API.