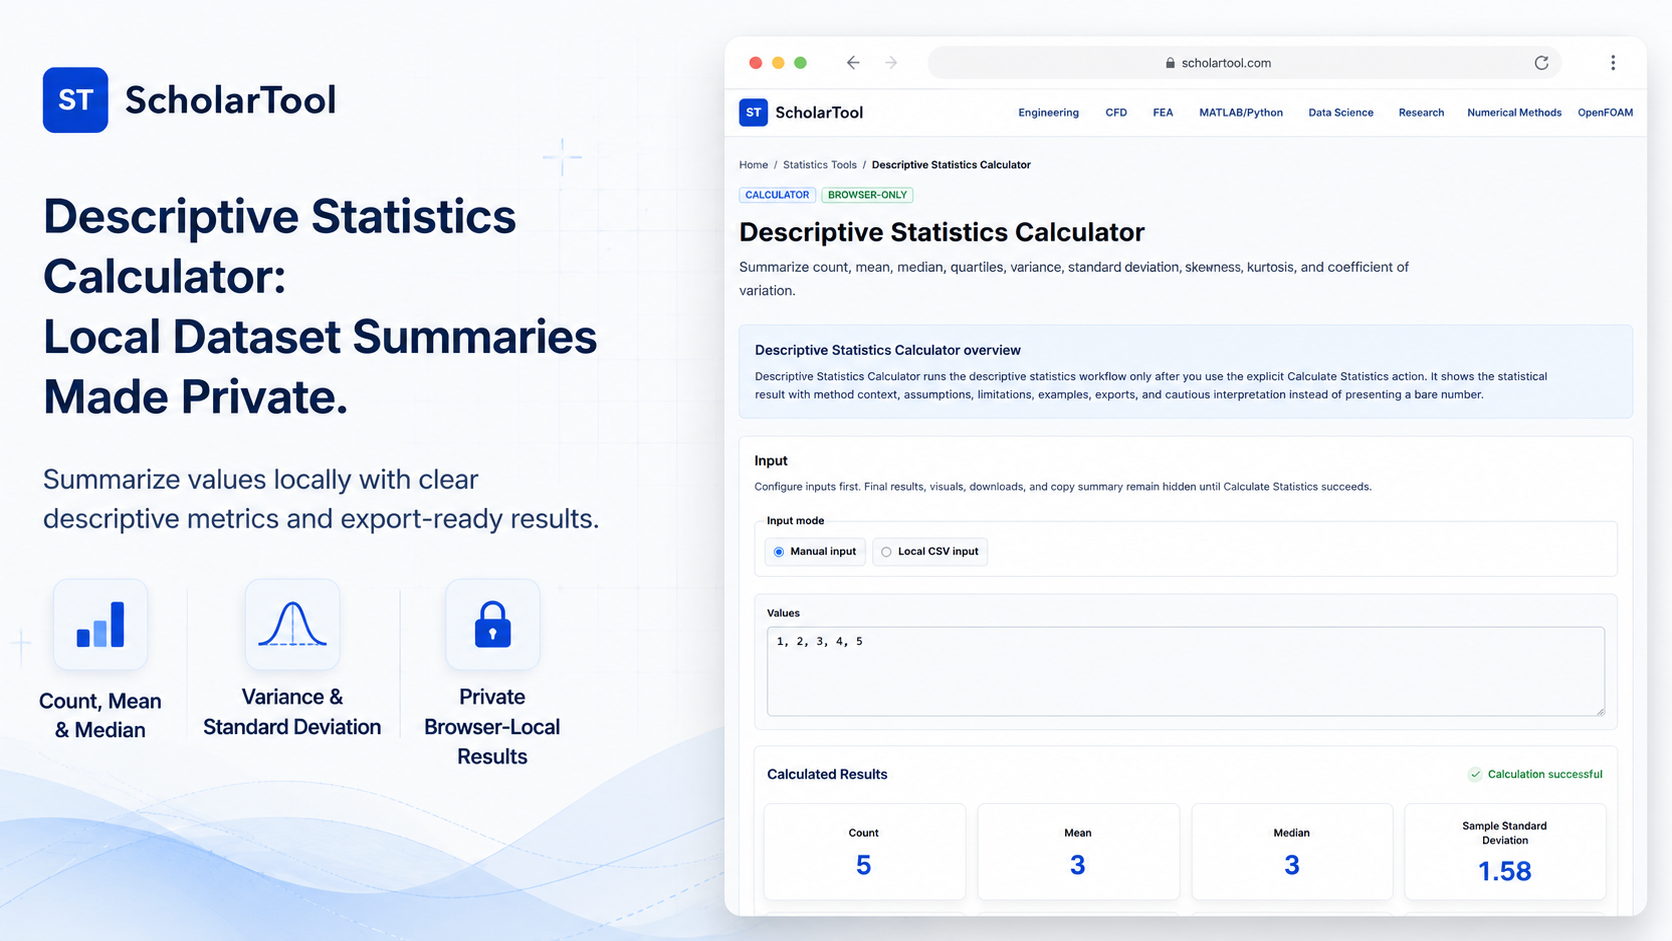
Descriptive Statistics Calculator: Browser-Local Tool
When laying out a research project, summarizing raw observations is the first point of friction. Every researcher must understand the central location, dispersion, and shape of their data before committing to complex modeling. Running high-stakes parametric tests without checking basic sample properties can lead to invalid conclusions and costly errors.
To solve this bottleneck with high accuracy and complete privacy, I use the Descriptive Statistics Calculator from ScholarTool. This browser-local statistics utility estimates count, mean, median, quartiles, variance, standard deviation, skewness, and kurtosis. Because all calculations execute locally on your device, your data matrices remain entirely private.
What the Descriptive Statistics Calculator Helps You Do
The tool acts as a preliminary analysis aid. It compiles a comprehensive statistical report without forcing you to struggle with manual formulas.
What I find useful here is that the tool separates raw input preparation from final reporting. It does not run calculations automatically while typing, preventing lag on larger datasets. Instead, it provides a deterministic “math receipt” of your sample only when you click the calculate action.
From a comparative perspective, while professional programs like Dataplot or StatCrunch require steep learning curves and cloud uploads, this browser-local calculator does the heavy arithmetic instantly without setup hassle.
Inputs You Can Use
The ScholarTool interface is designed with a configuration-first layout to ensure your assumptions are explicitly defined. You can choose these core parameters:
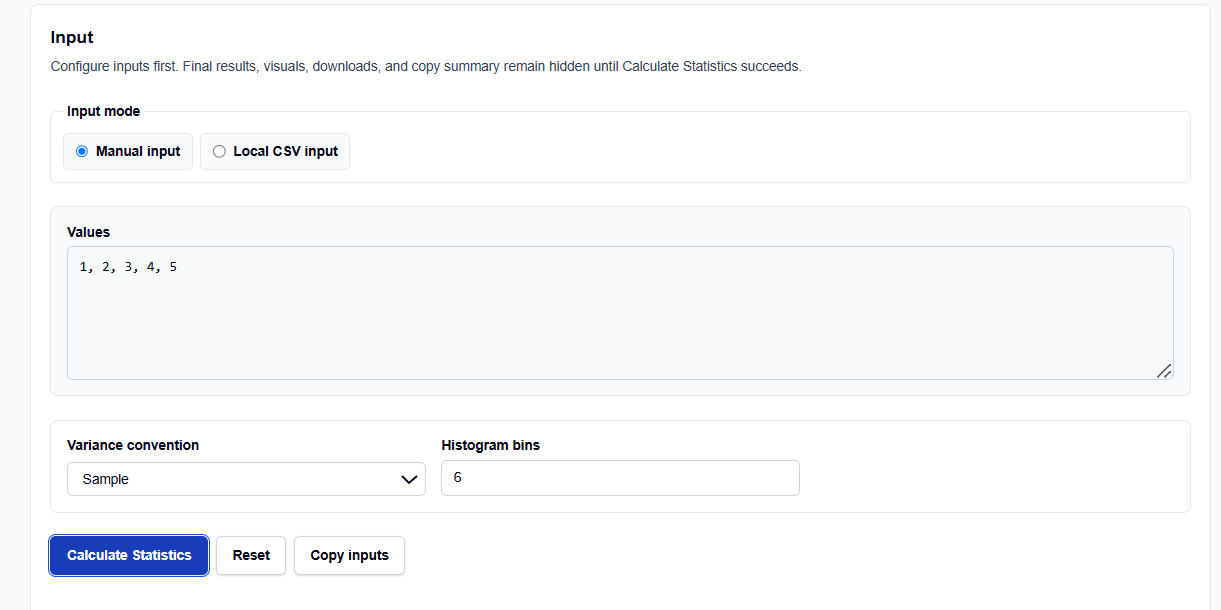
- Input Mode: Select manual numeric entry or loading a local CSV file.
- Values Area: Paste raw numeric values separated by commas, spaces, or newlines.
- Variance Convention: Toggle between Sample variance (using \(n – 1\) as the divisor) and Population variance (using \(n\)).
- Histogram Bins: Specify the number of bins (default is 6) to control the granularity of your visual data distribution.
How I Use the Tool
My typical workflow begins when I receive a fresh survey takeoff. I open the Descriptive Statistics Calculator.
Select your input mode. If your data is available in this form, paste values directly into the text area. Or load a local CSV file to parse a specific column. Next, select either the sample or population variance convention. Once set, click Calculate Statistics. All output summaries, visual histograms, and download options remain completely hidden until this action succeeds. If you edit any value afterward, the results automatically hide.
Understanding the Results
The result section helps you verify the sample characteristics by presenting several structured outputs:
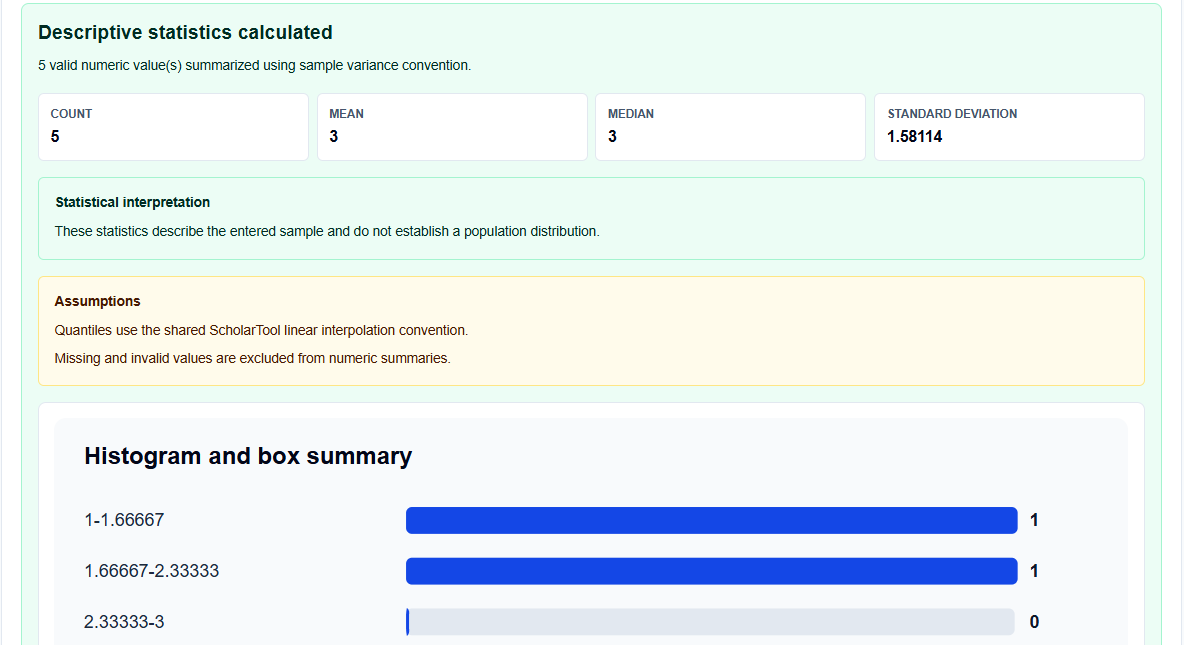
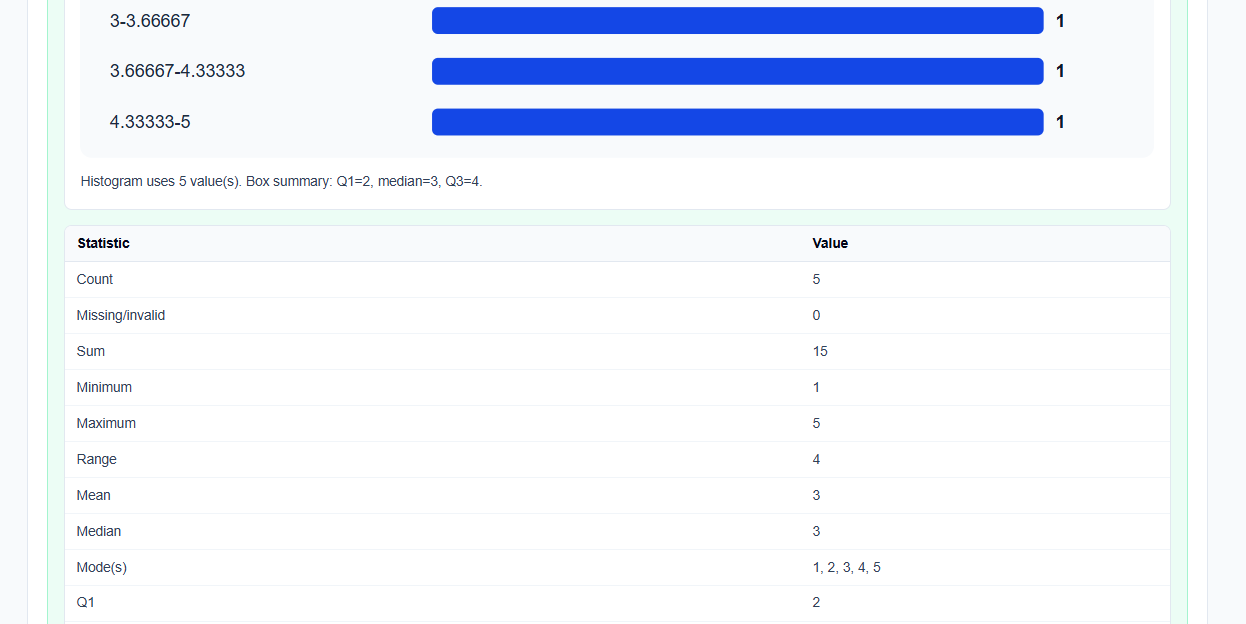
- Count (\(n\)) & Location: Outputs the sample size, mean (\(\bar{x}\)), and median.
- Dispersion: Displays the standard deviation (\(s\)), variance (\(s^2\)), and interquartile range (IQR).
- Quartiles: Reports the 25th (Q1), 50th (Q2), and 75th (Q3) percentiles using the linear interpolation convention.
- Shape & Variation: Displays skewness (asymmetry), kurtosis (tail weight), and the coefficient of variation (standard deviation divided by absolute mean).
- Visual Histogram: Renders a clean distribution chart using your selected bin count to show the data’s “footprint”.
A Practical Example: The Five-Point Sample
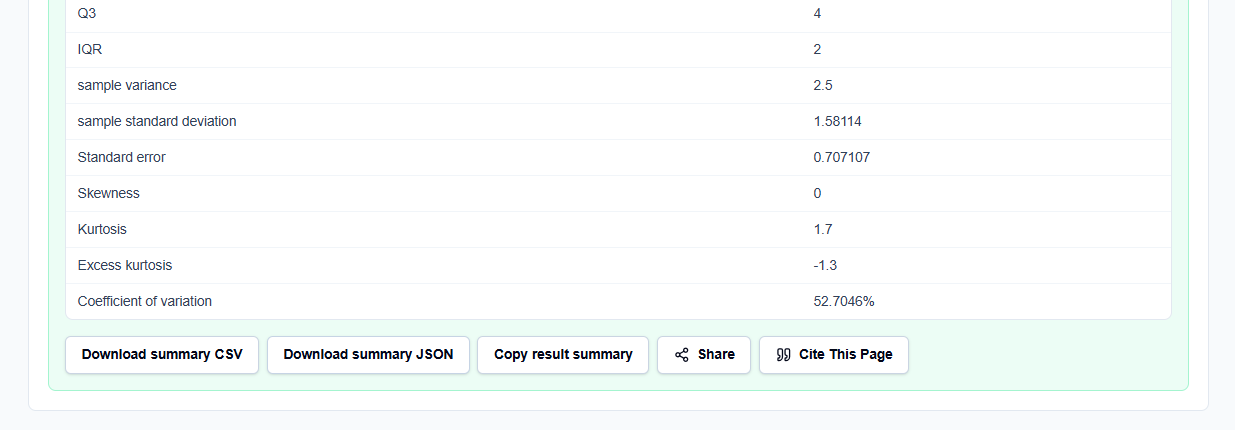
Consider a realistic statistics check. I am evaluating a sample of five experimental measurements: 1, 2, 3, 4, and 5.
When I enter these values and click calculate, the tool evaluates:
- Sample Mean (\(\bar{x}\)): \[\bar{x} = \frac{1 + 2 + 3 + 4 + 5}{5} = 3\]
- Sample Variance (\(s^2\)): \[s^2 = \frac{(1-3)^2 + (2-3)^2 + (3-3)^2 + (4-3)^2 + (5-3)^2}{5 – 1} = 2.5\]
- Sample Standard Deviation (\(s\)): \[s = \sqrt{2.5} \approx 1.581\]
This displays results alongside a clean 6-bin histogram.
Mistakes I Would Avoid
One critical mistake is comparing sample and population standard deviations without checking your selected convention. Using the population formula for small samples underestimates variability, compromising downstream parametric testing.
Another major pitfall is treating descriptive statistics as a distribution proof. A symmetric histogram and low skewness do not guarantee normality; you should always run a rigorous normality test.
Try the Free Descriptive Statistics Calculator
If you want to eliminate manual spreadsheet errors, try the tool today. It is free, private, and runs entirely in your local browser tab.
Try the Descriptive Statistics Calculator on ScholarTool You can easily chain this summary with the Normality Test Calculator or Confidence Interval Calculator. You can also prepare raw files using Data Science CSV Tools.
FAQ
1. Does the Descriptive Statistics Calculator calculate automatically while I type?
No. Inputs and CSV previews do not produce final statistics until you click “Calculate Statistics”, preventing lag on larger datasets and ensuring that you control when calculations execute.
2. Are my proprietary CSV files or manual entries uploaded to any external server?
No. All manual inputs and CSV files are processed locally on your device in your browser’s page state. ScholarTool does not transmit your records or files to any third-party database, keeping your drawings and research files secure.
3. What quartile convention does this statistics calculator use?
The tool reports the 25th, 50th, and 75th percentiles using the linear interpolation convention shared across the Data Science suite, ensuring consistent reporting across your takeoff workflows.