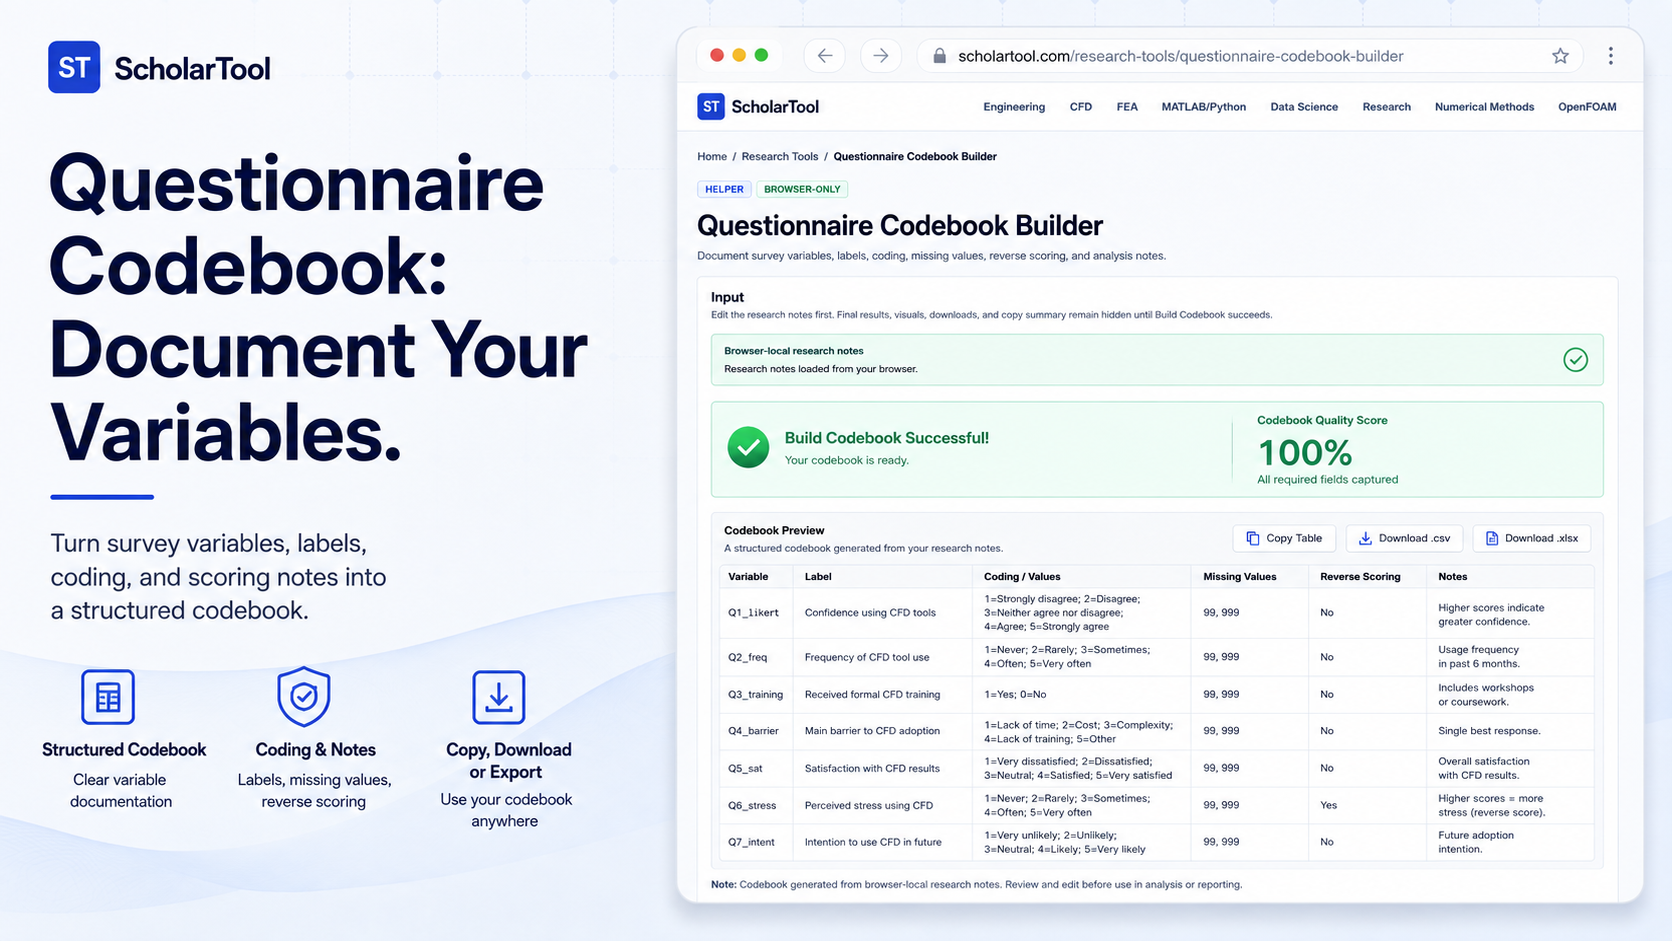
Questionnaire Codebook Builder: Survey Documentation Tool
When I begin the data preparation phase of a survey project whether I am investigating the thermal efficiency of micro-channels or mapping student attitudes toward simulation tools the “first point of friction” is rarely the high-level analysis. Instead, it is the daunting task of organizing my variables into a coherent, stable frame. As noted by experts at the CDC, a structured codebook is the foundation on which an analyst’s arguments rest, providing a “stable frame” for the dynamic analysis of text and data. Without this foundation, your methodology is at risk of becoming a “subjective process stitching a patchwork quilt of references”.
I find that for many graduate students, the gap between drafting a questionnaire and running a t-test is often filled with manual spreadsheet errors and undocumented coding decisions. That is why I use the Questionnaire Codebook Builder from ScholarTool. It is a deterministic, browser-local research utility designed to convert your structured notes into a transparent “math receipt” featuring a codebook table, coding summary, and missing-value plan. It prioritizes data residency, ensuring your proprietary research plans never leave your machine.
What the Questionnaire Codebook Builder Helps You Do
The primary purpose of this tool is to help you move from a “pile” of questions to a structured writing workflow fit for a thesis or manuscript. In technical terms, it performs a rule-based parse of your variable descriptions to report readiness percentages and identify missing decisions.
What I find useful here is the focus on “transparency of interpretation.” Unlike cloud-based assistants that might offer a “black box” solution, this builder requires you to define the boundaries of your informational terrain. It uses deterministic browser-side rules to split your rows into an auditable table, identifying names, types, and missing rules. This ensures that your final data dictionary is grounded in your own critical evaluation rather than a hallucinated algorithm.
Inputs You Can Use
The interface is built with a configuration-first layout that requires you to be specific about your variables before any artifact is generated.
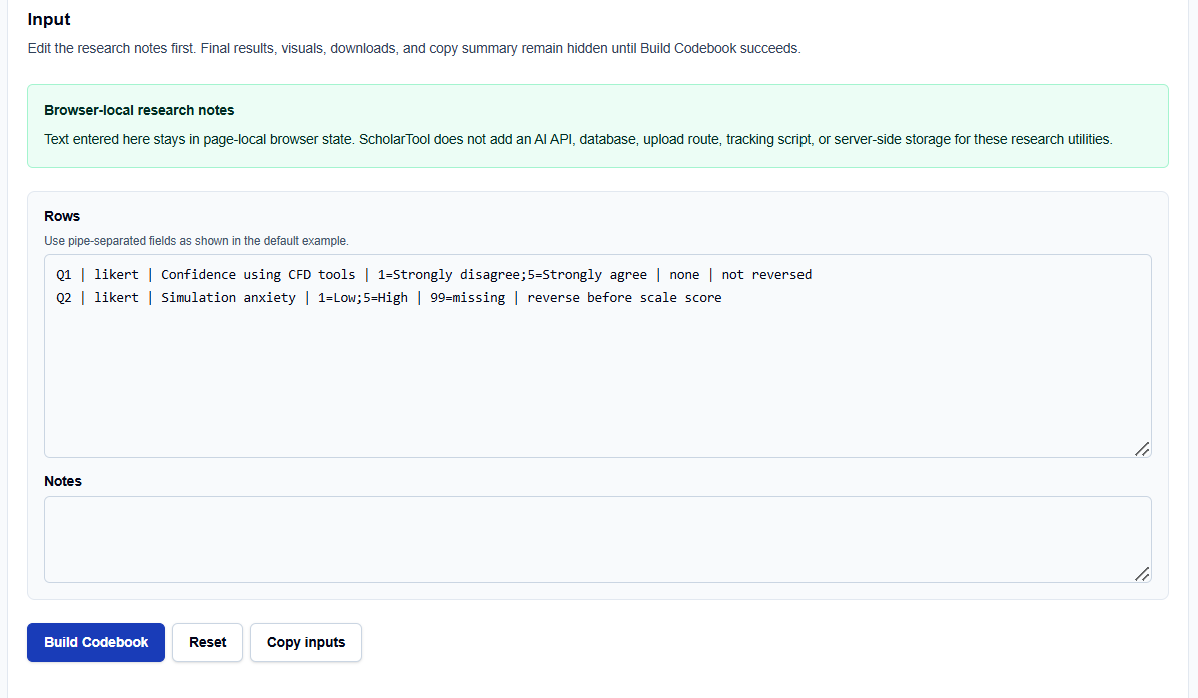
Structured Variable Rows
In the Rows field, you enter your data using a simple, pipe-separated format. I typically enter six fields: Name | Type | Label | Coding | Missing Rule | Note. For example, following the GSS standard where mnemonics are often limited to eight characters for software like SPSS, I might enter CFD_CONF | likert | Confidence using CFD | 1=Low;5=High | none | not reversed.
Free-Text Research Notes
Below the rows, you can enter free-text Notes regarding your overarching methodology or supervisor feedback. What I find indispensable is that all this text stays entirely within the page-local browser state; ScholarTool does not add an AI API, database, or server-side storage for these utilities. This is a vital professional safeguard if you are handling sensitive human-subjects data or proprietary identifiers.
How I Use the Tool
My typical workflow starts during the protocol development phase, where Umberto Eco suggests treating your table of contents as a “working hypothesis”. I open the Questionnaire Codebook Builder.
I replace the default example rows with my own project-specific variables. Once I have defined my coding logic and missing-value plan, I click Build Codebook. I find it practical that the results, visuals, and downloads remain hidden until this action succeeds, preventing me from acting on stale data. If I change a single input row later, the tool automatically hides the old result a vital professional safeguard to ensure the output always matches the current plan.
Understanding the Results
The result section provides a Codebook Table first, identifying the juxtapositions between your variable names and their numeric values. For a professional audit, I focus on:
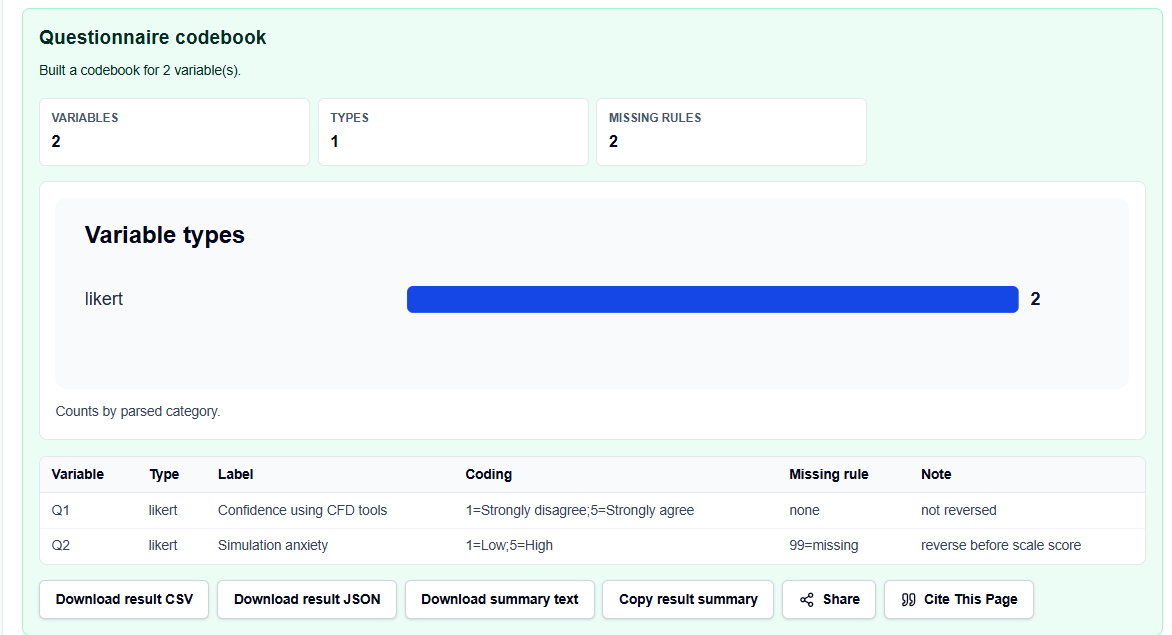
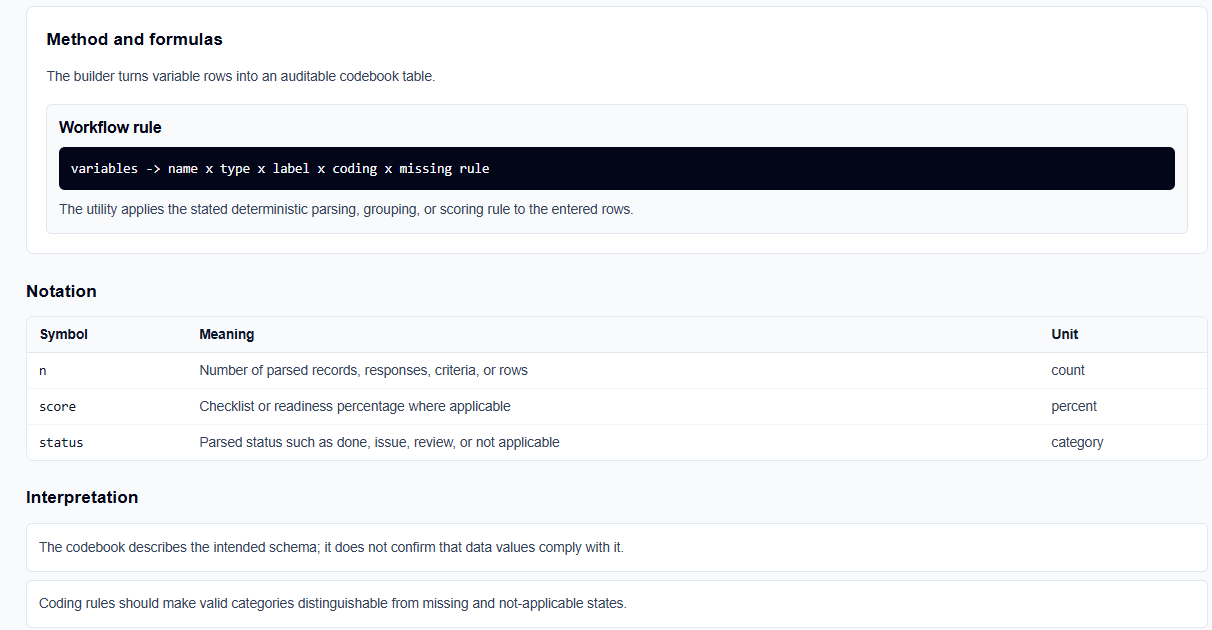
- n and Score: The tool reports the count of parsed records ($n$) and a readiness percentage ($score$). I follow the tool’s warning: a high score means fewer checklist gaps, not guaranteed academic quality or supervisor acceptance.
- Status Classification: The tool groups rows by status (such as done, issue, or review), helping me identify “missing decisions” in my coding early in the workflow.
- Export Actions: I frequently use the copy and download features to move this table into my research log or as an appendix for a dissertation.
A Practical Example: The Simulation Survey
Suppose I enter two rows regarding a student survey:
- Sim_Anx | likert | Simulation anxiety | 1=Low;5=High | 99=missing | reverse before score.
- User_Sat | nominal | Software satisfaction | 1=Yes;2=No | none | check for outliers. After clicking the action button, the tool identifies “Sim_Anx” as a variable requiring reverse scoring. Seeing this “math receipt” allows me to justify my cleaning steps to a statistician with verified logic.
Mistakes I Would Avoid
One common pitfall is using a workflow score as proof of completion. As the tool’s guidance reminds us, the builder helps you organize decisions, but it does not validate questionnaire psychometrics or replace qualified professional judgment.
Another mistake is leaving example rows in place. Always ensure your inputs are project-specific to avoid generating a misleading documentation artifact for your team.
Try the Free Questionnaire Codebook Builder
Before you manually struggle with a list of codes in a word processor, take a minute to generate a transparent variable draft. It is the fastest way to ground your research preparation in structured logic while maintaining total browser privacy.
Try the Questionnaire Codebook Builder here.
To complete your research toolkit, you may also find the Likert Scale Analyzer or the Research Data Cleaning Checklist essential for your academic success.
FAQ
1. Does the Questionnaire Codebook Builder upload my data to a server?
No. The utility runs entirely in your browser using page-local state. ScholarTool does not add a database, API upload route, tracking script, or AI service for your research text, ensuring total data residency.
2. Can I use this for non-Likert variables?
Yes. While the example shows Likert scales, you can document any variable type (nominal, ordinal, interval, or ratio) by specifying its coding and labels in the pipe-separated rows.
3. Why do the results disappear when I edit a note?
The builder is designed to prevent the accidental use of stale workflow artifacts. If you change your inputs, the previous output is hidden until you click “Build Codebook” again, ensuring that your exported table always matches your latest decisions.