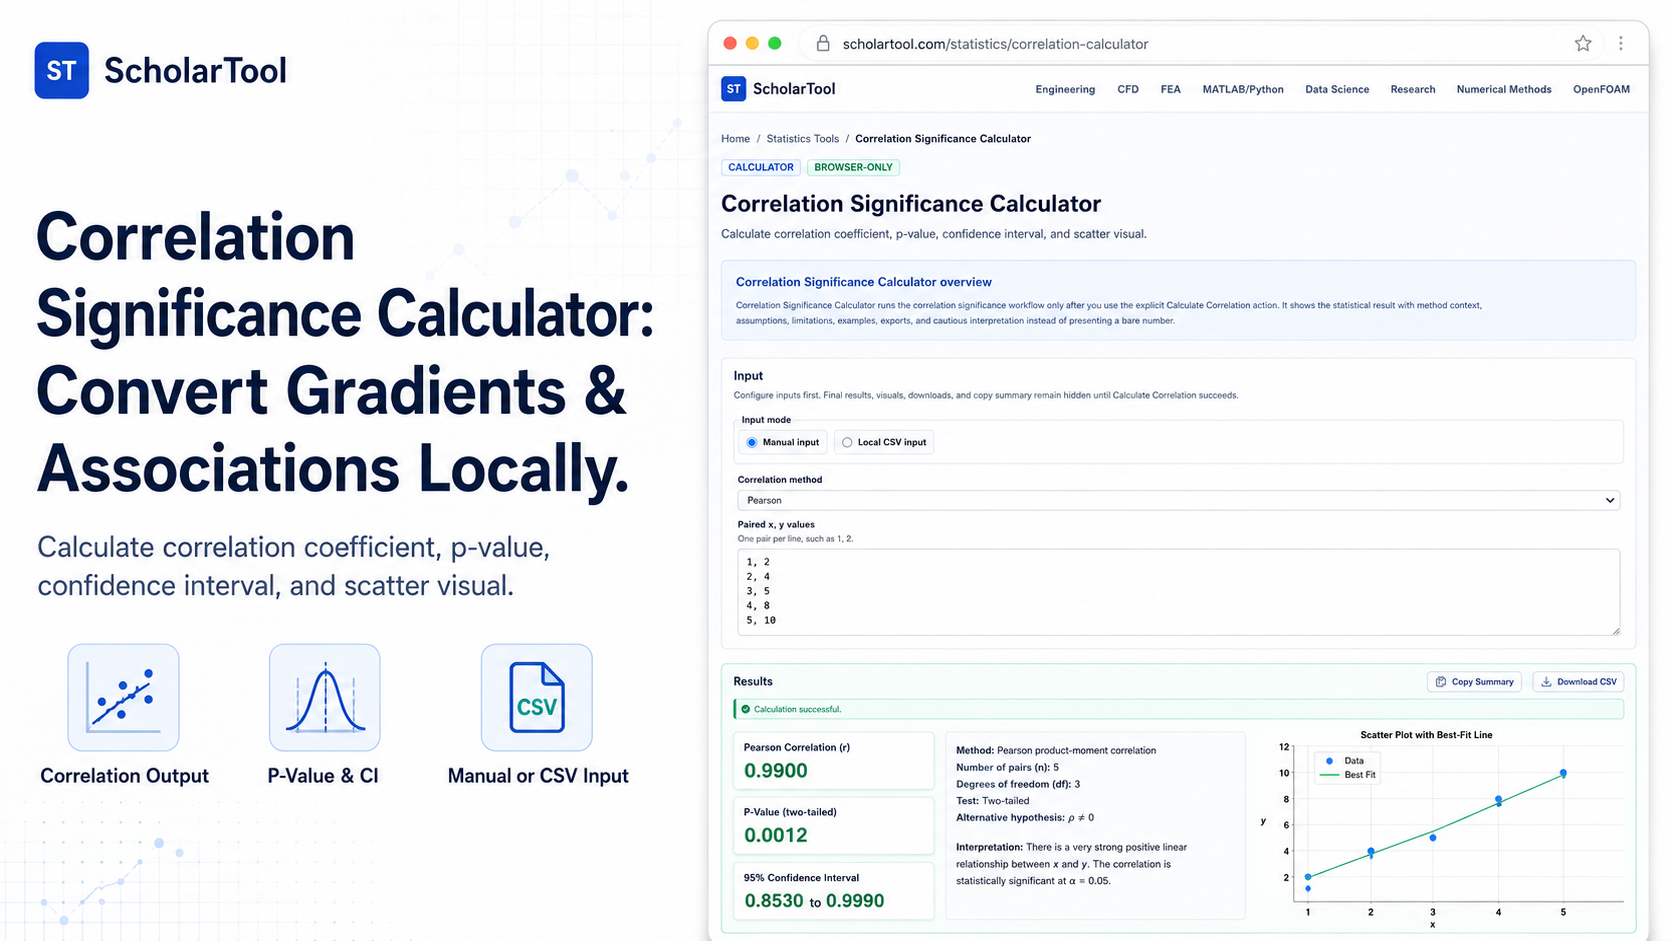
Correlation Significance Calculator: Private Bivariate Sizer
When transitioning a quantitative research project from raw data coordinates to reporting, establishing whether an association is real is the first point of friction. Every researcher must determine if a correlation is statistically significant or a random coincidence. Staring at draft tables and guessing these relationships without an auditable planning receipt risks overclaiming linear patterns or ignoring sample limitations.
To bridge this bottleneck with high accuracy and complete privacy, I use the Correlation Significance Calculator from ScholarTool. This browser-local utility estimates the correlation coefficient, p-value, confidence interval, and scatter visual. Because calculations execute entirely in your local browser tab using client-side TypeScript logic, your proprietary observations are never uploaded to a cloud database, ensuring 100% data sovereignty.
What the Correlation Significance Calculator Helps You Do
The primary purpose of this tool is to act as an exploratory data analysis takeoff aid during early research planning and verification. Rather than forcing you to configure heavy programming environments or pay for expensive software, it organizes parameters into a clear, structured framework.
What I find useful here is how the tool accommodates both linear and ordinal relationships. It allows you to toggle between Pearson and Spearman tests, providing the flexibility to assess both raw interval metrics and monotonic rank associations. This comparative capability helps you quickly run sensitivity checks, showing how p-values and Fisher intervals respond as your alpha levels or alternative hypothesis directions change.
Inputs You Can Customize
The interface features a configuration-first layout to ensure your assumptions are explicitly documented:
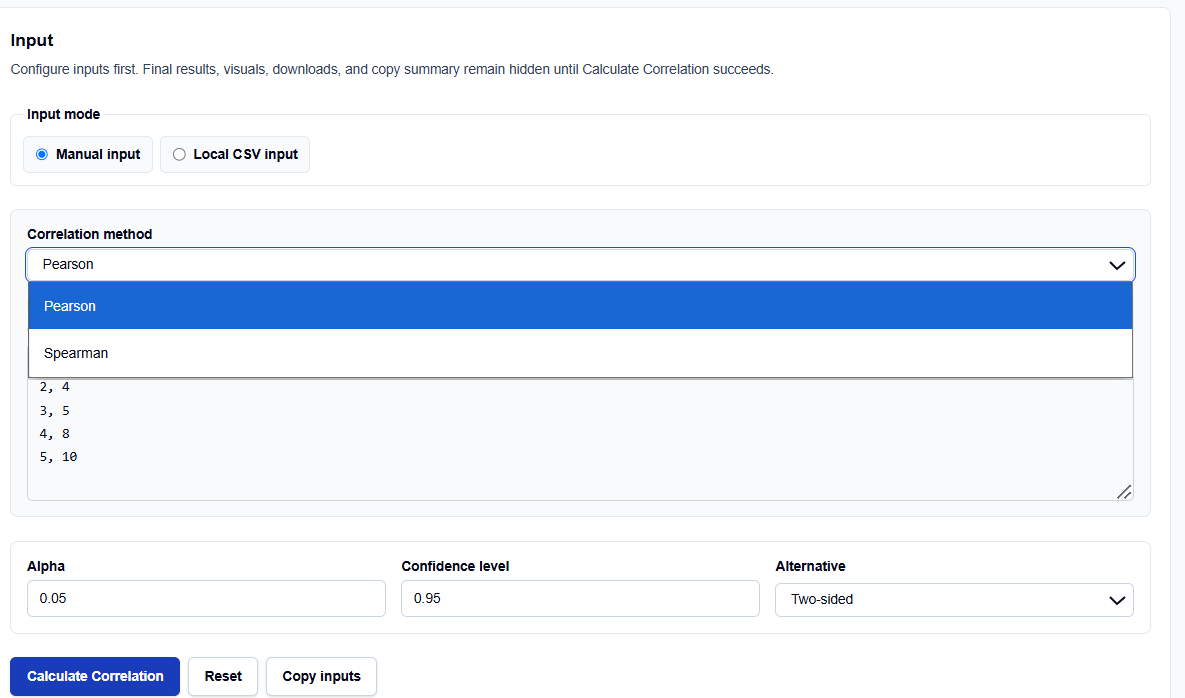
- Input Mode: You can choose manual numeric entry or load a local CSV file directly to match your raw source sheets.
- Correlation Method: Select Pearson for linear association on raw values, or Spearman to convert paired values to tied ranks.
- Paired Values Area: If your data is available in this form, paste raw paired x and y coordinates with one pair per line.
- Alpha & Confidence Levels: Specify your target significance threshold (default is 0.05) and interval bounds (default is 0.95).
- Alternative Hypothesis: Toggle between Two-sided, Greater than null, or Less than null.
How I Use the Tool
I open the Correlation Significance Calculator. First, select your input mode.
When I enter raw coordinates into the manual text area, I verify that they are paired correctly by row. For instance, evaluating an alloy’s temperature versus hardness requires matching both readings for each sample. Next, you can choose the correlation method and alpha thresholds. Once set, I click Calculate Correlation. All output summaries, visual scatter plots, and download options remain hidden until this button is clicked. If you edit any value afterward, results automatically hide.
Understanding the Results
The result section helps you verify the association characteristics by presenting several structured parameters:
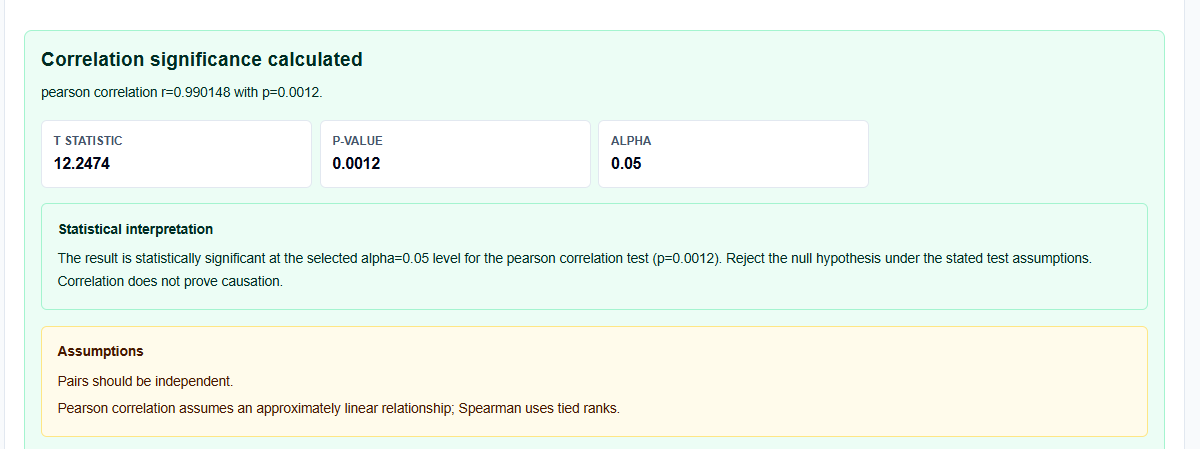
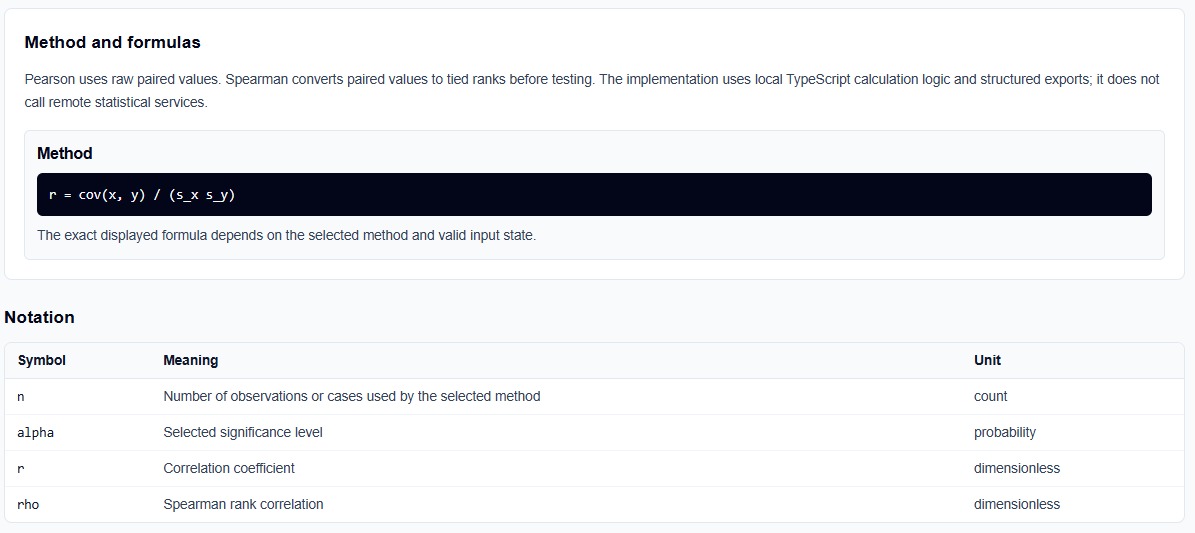
- Correlation Coefficient: Displays Pearson’s r or Spearman’s rho to describe the direction and strength of the relationship.
- Standard Error & P-Value: Evaluates the probability that the observed association differs from zero under assumptions.
- Fisher Confidence Interval: Transforms the correlation coefficient onto an approximately normal scale to report boundaries.
- Visual Scatter Plot: Renders a clean visual distribution of your coordinate pairs to show the data’s “footprint”.
A Practical Example: Sizing Pearson Pairs
Consider a realistic baseline check of a five-point sequence of paired values: (1, 2), (2, 4), (3, 5), (4, 8), and (5, 10).
With alpha set to 0.05 and a two-sided alternative, we click calculate. The tool centers the values and evaluates:
- Covariance & Standard Deviations: Computes covariance of x and y and divides by the product of their standard deviations: \[r = \frac{\text{cov}(x, y)}{s_x s_y}\]
- Final Result: Pearson r is strongly positive, showing that x increases with y.
- Fisher Bounds: Renders approximate confidence intervals around the point estimate.
Mistakes I Would Avoid
One critical mistake is inferring causation from correlation. A significant coefficient indicates a strong mathematical relationship, but correlation does not prove causation or rule out third-variable confounding.
Another major pitfall is testing constant columns. If a variable has no variation, standard deviations are zero, and the correlation coefficient becomes mathematically undefined.
Try the Free Correlation Significance Calculator
To avoid manual errors, try the tool today. It is free, secure, and processes all parameters locally in your browser.
Try the Correlation Significance Calculator on ScholarTool
Easily chain this comparison with our Descriptive Statistics Calculator or Simple Linear Regression Calculator. You can also prepare files using our Data Science CSV Tools or explore the Research Tools category.
FAQ
1. What is the benefit of the Spearman rank correlation method over Pearson?
Pearson evaluates linear relationships on raw interval values, which can be highly sensitive to uneven spacing and outliers. Spearman converts paired values to ranks first, rendering it more robust and defensible for monotonic non-linear associations.
2. Are my custom datasets or uploaded CSV rows sent to a cloud database?
No. All manual inputs and local CSV files are processed entirely locally on your device in your browser’s page state. ScholarTool does not transmit your records to any third-party calculation API or external database, ensuring 100% data sovereignty.
3. Why do results clear and hide automatically if I edit a parameter?
This is a built-in safety guard. If you modify any coordinate, alpha limit, or method option, the output block automatically hides until you click “Calculate Correlation” again, preventing stale statistical records from being copied onto your spreadsheets.